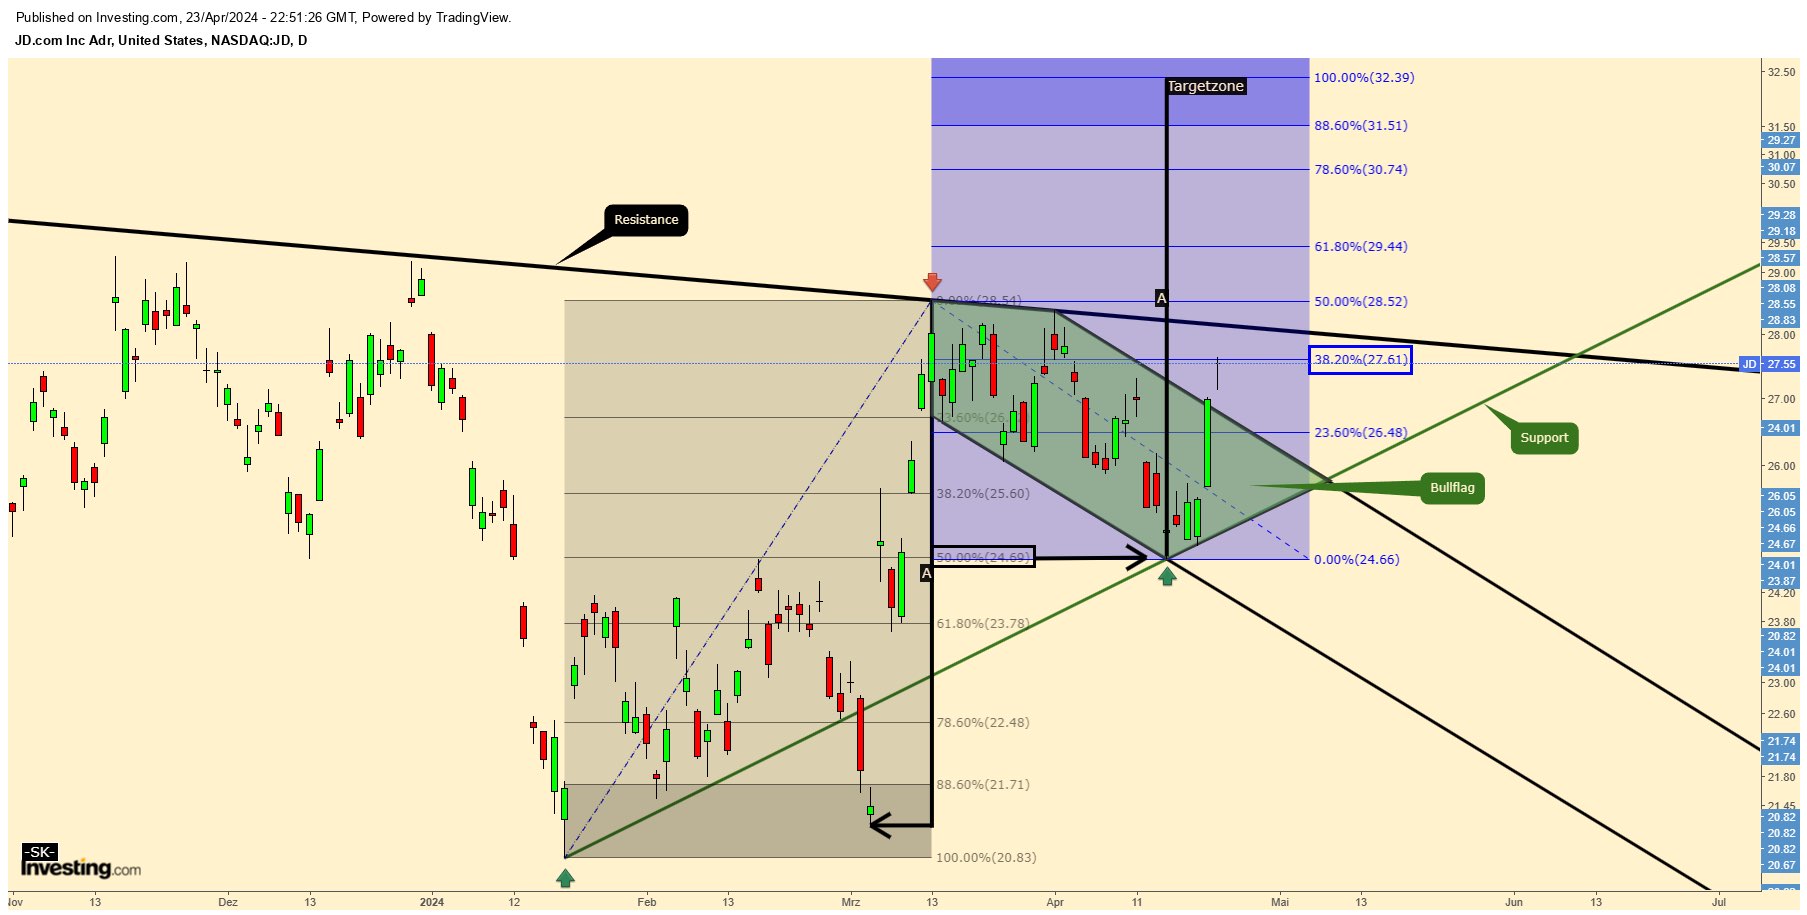
$JD.com(JD)$ There is no problem. The low on April 16 was exactly on the 50 Fibonacci line from the low on January 22 to the high on March 13 (black table). If we had reached the 61 Fibonacci (golden zone), I would have been worried about a trend reversal, but we bounced upwards off the support line. Accordingly, we were in a bull flag, from which we broke out to the upside.
Measured from the low (22. January) to last high (March 13) to the low (April 16), we are currently just below the 38 Fibonacci extension (blue table 27.61). We may test the upper limit of the bull flag once again in order to close the small gap, but after that we should continue higher.
Disclaimer: Investing carries risk. This is not financial advice. The above content should not be regarded as an offer, recommendation, or solicitation on acquiring or disposing of any financial products, any associated discussions, comments, or posts by author or other users should not be considered as such either. It is solely for general information purpose only, which does not consider your own investment objectives, financial situations or needs. TTM assumes no responsibility or warranty for the accuracy and completeness of the information, investors should do their own research and may seek professional advice before investing.
Comments