Summary
- Momentum factor funds have performed very well YoY, with SPMO rising twice as fast as the S&P 500 due to its exposure to the "AI trade."
- As Nvidia, Apple, Microsoft, and others dominate SPMO, it is more exposed to the risk of a burst of the retail-driven "AI bubble."
- Low individual investor cash allocations may be a solid bearish indication for stocks that are more popular among individual investors.
- SPMO has outperformed the iShares Momentum ETF, MTUM, with relative consistency since 2022, potentially because of its less risk-averse approach.
- Technology stocks in SPMO may have less direct cyclical economic risk but more exposure to the possibility of a liquidity-driven stock market correction.

Tom Merton/iStock via Getty Images
Momentum investing strategy ETFs, such as Invesco S&P 500® Momentum ETF (NYSEARCA:SPMO) rose in popularity in the late 2010s as the approach delivered significant outperformance to market-cap-weighted indices on a relatively consistent basis. These funds are designed to buy those large-cap stocks disproportionately with the best positive trends. In SPMO's case, it rebalances its holdings twice a year, giving it a relatively long-term approach to the momentum factor.
SPMO has performed well over the past year, but I believe key signs point to an impending slowdown. Although the bearish economic signals I've noted in numerous recent articles are among those signs, SPMO's high weighting toward technological growth makes it less directly exposed to cyclical economic risks. Theoretically, momentum strategies can reduce economic risk by shifting toward outperforming sectors.
However, should the music end too quickly that it cannot shift fast enough, I expect SPMO may be left with a notable underperformance. Its current technology holdings are not due to be rebalanced until September. Although most of those stocks have low "recession exposure," they have some, but more importantly, are firms with extremely high valuations. Thus, I believe SPMO will likely underperform over the coming months, subject to a reversal in the "AI trade."
Momentum's "AI" Exposure Points to a Bubble
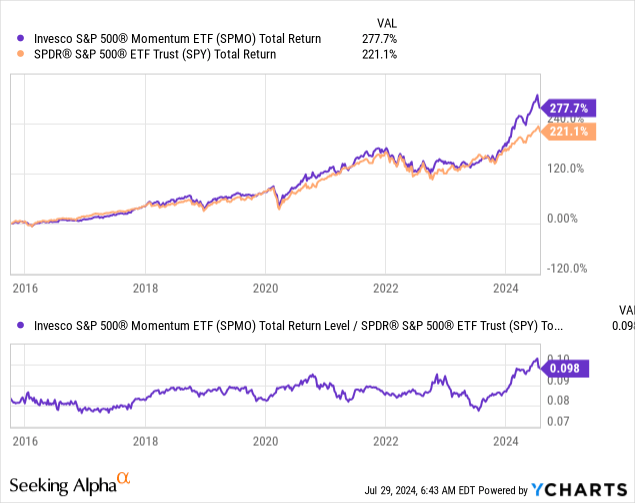
SPMO's performance over the past year has been remarkable, rising by around 50% compared to the S&P 500's ~20%. However, SPMO's performance, though superior to SPY, has been inconsistent since inception. Looking at a ratio of the total returns of each, we can see some ebb and flow in SPMO's relative performance to the S&P 500. See below:
 Data by YCharts
As SPMO underperformed from mid-2022 to mid-2023, it has done the opposite since, seeing its total outperformance rise to a historically slow level. In other words, the momentum behind "momentum" may be fading.
Fundamental factors impact SPMO, specifically the "AI trade," which is primarily the driving factor behind its ongoing gains. Roughly 52% of its holdings are in technology. It is dominated by the top AI and retail brands in technology, such as Nvidia (NVDA) (12% of holdings), Apple (AAPL) (10%), Microsoft (MSFT) (8.5%), and Meta (META) (7.8%). In my view, these stocks have high social popularity, making them prime buying targets among many retail investors, giving them an added risk of overvaluation.
As of the end of June, SPMO had an overall "P/E" ratio of ~43X. Although it has lost around 4% in value since then, its valuation is still around that level. Around 64% of these stocks are in the growth segment, so strong EPS growth targets should offset their high valuations. Many expect giants like Apple and Microsoft to continue to see strong earnings growth indefinitely, but other economic factors may weigh on them at some point.
Of course, there is also the direct impact of market liquidity levels. These stocks are popular among individual retail investors. Indeed, I believe SPMO should consistently be biased toward stocks that are more popular amongst retail investors, considering trend-following activity seems somewhat more common than value investing amongst individual investors.
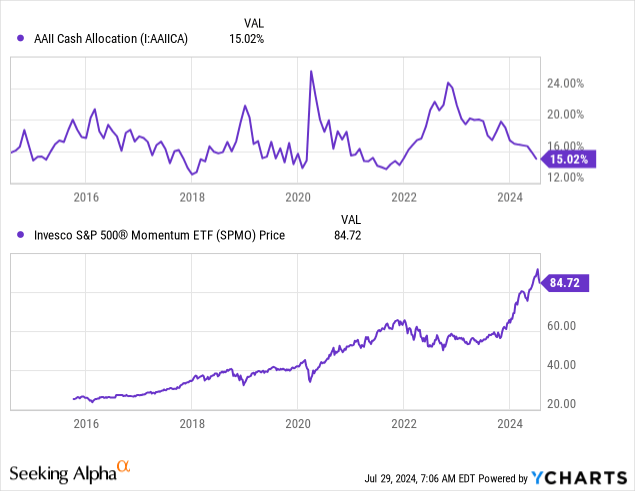
At any rate, the peaks and troughs in SPMO are generally aligned with those of individual investor cash balances. This is also true for most large-cap funds, but it is notable for SPMO in recent years, particularly in the most recent rally. When individual investor's cash allocations are high, such as in early 2023, 2020, 2019, and 2016, SPMO's subsequent performance has been strong. However, when cash balances are low, such as at the end of 2017, 2019, 2021, and today, SPMO has usually faced a sharp correction at some point over the following six months. See below:
 Data by YCharts
Cash allocations are one of my favorite market gauges, as they give us a relatively direct indication of how much cash is waiting on the sidelines to invest. As rates rose in 2022, many feared the economy would abruptly slow, leading to weaker stocks; however, that concern drove many away from stocks and bonds toward cash.
Today, I believe we're finally seeing solid indications of economic weakness associated in part with higher rates (though the lack of QE is more notable). Most individual investors have deployed the bulk of their cash positions, meaning there isn't nearly as much money on the sidelines as before. Thus, should momentum slow, there may be many sellers and a lack of potential buyers due to a lack of investor liquidity. SPMO may be particularly exposed to this risk because it disproportionately owns very high-valuation stocks that may be in a bubble today, led partly by the now-slowing "AI trade."
The Bottom Line
Based on my economic outlook, market trends, and indicators, I expect that not only will SPMO have a negative performance over the coming months, but it will also underperform the S&P 500. Further, given the recent "rotation trade" away from large companies hyped for AI toward smaller stocks, there is reason to expect weak performance among large caps.
If SPMO had a higher rebalance frequency, this may not be a huge issue as it could transition toward those segments with more stability. However, I expect it will not rebalance until after its current holdings have underperformed, given it may retain much of these holdings in its September rebalancing.
Still, not all is negative for SPMO. For one, it is worth pointing out that it has had relatively consistent outperformance compared to the iShares momentum ETF (MTUM). MTUM also rebalances every six months but has a different model for selecting stocks, which is supposed to reduce risk. MTUM's holdings are more diversified than SPMO's today, with a lower overall "P/E" valuation of 31X. Both have low expense ratios, around 13 to 15 bps, but SPMO has outperformed by a decent margin (~25%) since 2022. See below:
 Data by YCharts
These models are proprietary, so it is impossible to pinpoint the exact cause of SPMO's outperformance. In my view, SPMO is likely more of a "pure play" momentum approach, given its holdings are less diversified and more tech-heavy than MTUM's. That may give SPMO more risk exposure to the threats from the rotation trade; however, its comparative outperformance is notable.
Still, although there may be merit to SPMO's strategy, I believe the momentum style is losing momentum as rotation and value return with force. Of course, if we see another wave of technology stock performance, SPMO may continue to outperform. However, given the sharp rise in valuations and low individual investor cash on the sidelines, I believe that is quite unlikely.
Comments