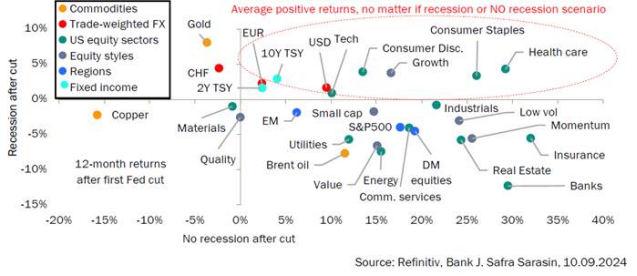
The market widely anticipates that the Fed will cut rates for the first time this cycle. Historically, rate cuts can lead to very different outcomes for various asset classes and sectors, depending on whether the economy enters a recession or avoids one.
If a recession occurs, U.S. stocks typically drop an average of 4% within 12 months of the first rate cut. However, if the economy avoids a recession, stocks usually rise by about 18%. This means the broader macroeconomic scenario after the initial rate cut becomes more crucial than the cut itself.
In a recessionary environment, fixed-income assets like U.S. Treasuries generally outperform stocks. Regardless of whether the investment horizon is 3, 6, or 12 months post-cut, U.S. Treasuries consistently perform better than stocks. This makes government bonds an attractive option for investors looking to protect their portfolios during economic downturns.
On the flip side, if the economy sidesteps a recession, stocks typically outperform bonds by about 15% over the next 12 months.
Tech Growth Stocks + defensive sectors
Among all rate cut cycles, growth stocks, particularly in tech, have shown stable performance. They tend to rise an average of 9% in the 12 months following the Fed's first cut, generating positive returns in both recessionary and non-recessionary environments.
Within healthcare, the biotech subsector is particularly popular. The largest biotech ETFs are managed by BlackRock ( $iShares Biotechnology ETF(IBB)$ ) and State Street ( $Spdr S&P Biotech Etf(XBI)$ ). The main difference between them lies in the indices they track: IBB has stronger mid-term performance, while XBI shows better long-term results with lower fees.
For those looking to capitalize on XBI's gains post-rate cut, considering a spread strategy could be a smart move.
What Is a Bull Put Spread Strategy?
A bull put spread involves selling a put option while simultaneously buying another put option with the same expiration date but a lower strike price, both on the same underlying asset. Since the premium received from selling the put is higher than the premium paid for buying the put, investors typically end up with a net premium.
This strategy is ideal for investors who expect the market to rise, but only modestly, and who want to limit their exposure to a significant downturn.
Example of a Bull Put Spread with XBI
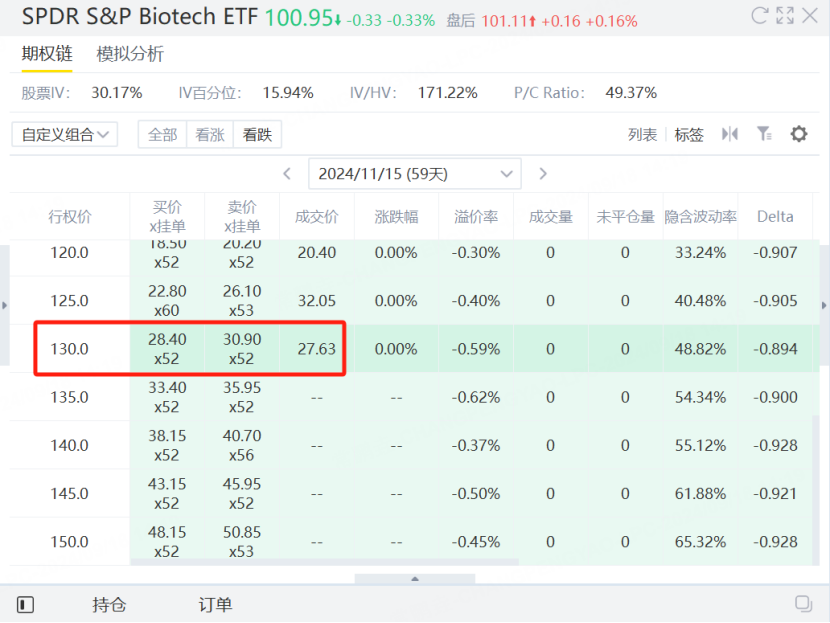
Step 1: Sell Put Option: Strike price of $130, expiring on November 15, premium received of $3,000.
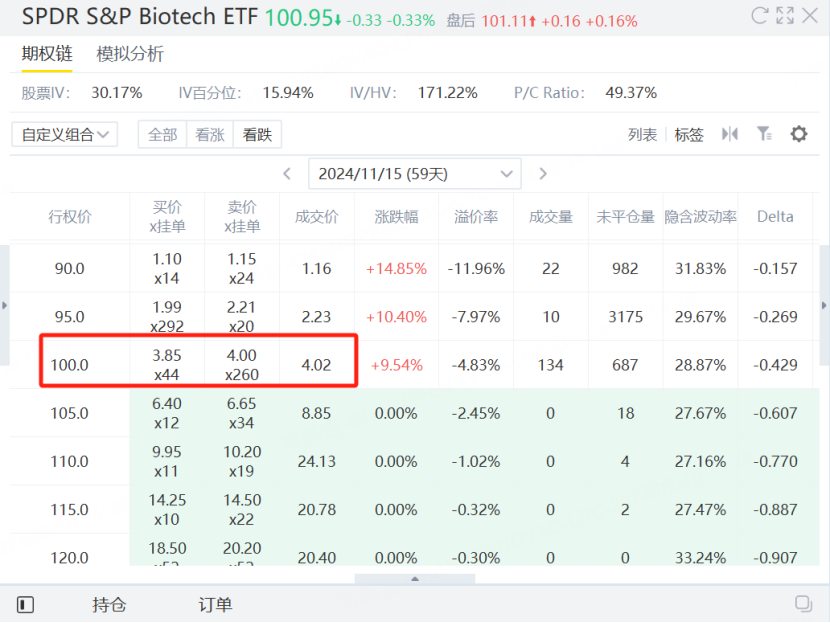
Step 2: Buy Put Option: Strike price of $100, expiring on November 15, premium paid of $390.
1.Net Premium Income
-Premium Received: $3,000
-Premium Paid: $390
Net Premium Income: $3,000 - $390 = $2,610
2.Profit and Loss Analysis
Scenario 1: Stock Price Above $130 at Expiration
Both options will not be exercised. The investor will pocket the net premium income of $2,610.
Scenario 2: Stock Price Between $100 and $130 at Expiration
-The sold put option at the $130 strike price will be exercised, as will the bought put option at the $100 strike price.
-The investor will need to pay the difference of $130 minus the stock price, but will receive the difference of the stock price minus $100.
-Final Profit/Loss = $2,610 - (130 - Stock Price) + (Stock Price - 100) = $2,610 - $30 = $2,580.
Scenario 3: Stock Price Below $100 at Expiration
-Both the sold put option at the $130 strike price and the bought put option at the $100 strike price will be exercised.
-The investor will pay a total of $30 for the difference between the two strikes.
-Final Profit/Loss = $2,610 - $3,000 = -$390.
3.Summary
In the best-case scenario, the investor can earn $2,610. In the worst-case scenario, the maximum loss is $390. This makes for a very favorable risk-reward profile for this investment strategy.
Comments