$lululemon athletica (LULU) $The next quarterly financial report (Q3 2025) is expected to be on December 11, 2025 (Thursday, after the US stock market closes)Release.
The market consensus expects that the total revenue for the quarter will be approximately US $2.486 billion, a year-on-year increase of 5.49%; Adjusted earnings per share were approximately US $2.21, a year-on-year decrease of 17.94%; EBIT was approximately US $374 million, a year-on-year decrease of 19.56%; The revenue guidance range disclosed by the company last quarter was US $2.535 billion to US $2.560 billion, a year-on-year increase of approximately 7% to 8%. Regarding this quarter's forecast of gross profit margin, net profit or net profit margin, the market public consensus expectation does not provide specific data. The highlight of the company's main business lies in the stable contribution of the company's self-operated stores and e-commerce channels, of which the company's self-operated store revenue is approximately US $1.255 billion and e-commerce revenue is approximately US $993 million. The highlights of the existing business with the greatest development prospects are international business expansion and new products. Among them, the international business grew rapidly year-on-year in the last quarter, and the overall revenue increased by 6.50% year-on-year to US $2.525 billion.
The company's revenue last quarter was US $2.525 billion, a year-on-year increase of 6.50%; Gross profit margin is 58.50%, and the year-on-year change is not disclosed; Net profit attributable to the parent company was US $371 million, an undisclosed year-on-year increase and a month-on-month increase of 17.91%; The net profit rate is 14.69%, and the year-on-year change is not disclosed; Adjusted earnings per share were $3.10, a year-over-year decrease of 1.59%. Last quarter, the company lowered its full-year performance guidance, emphasizing the pressure on same stores in North America and the profit pressure brought by tariffs. In terms of main business, the company's self-operated store revenue is US $1.255 billion, e-commerce revenue is US $993 million, and other channel revenue is US $277 million. The overall business structure shows that offline accounts for about 49.70%, online accounts for about 39.33%, and the international market maintains double-digit growth.
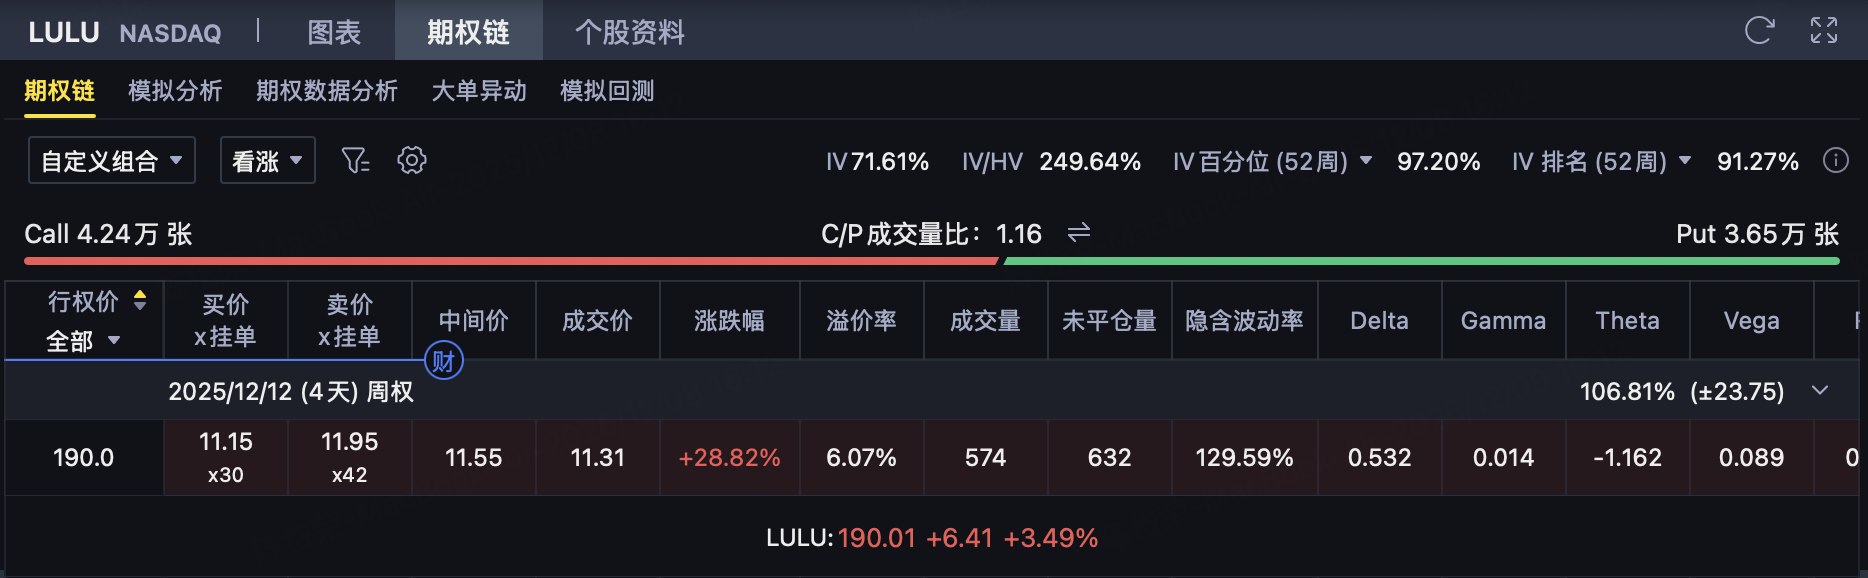
The current implied volatility IV of Lululemon has reached a historical high, with an IV/HV of 249.64%, and both the IV percentile and IV ranking are above 90%.

Reverse Calendar Spread Reverse Calendar Spread
A reverse calendar spread is aSell near-month options, buy far-month optionsStrategy, the strike price of options is usually the same.
As opposed to "positive Calendar Spread (Calendar Spread: buy near month, sell far month)".
When to Use Reverse Calendar Spreads?
Usually used to judge:
Expect short-term volatility to decline
Because you sell in the near month (θ is fast, vega sensitivity is high), if the short-term IV falls → the seller makes more money.
It is expected that the underlying price will experience a large breakout in the short term
The reverse calendar maximum gain point usually occurs at a deviation from the strike price, rather than near it.
You wish:
Near-month optionsQuick zeroing or limited loss
Far Month OptionsBenefit from greater absolute price volatility
Hence it isSee the direction fluctuates sharplyOrLook at short-term IV declineStrategy.
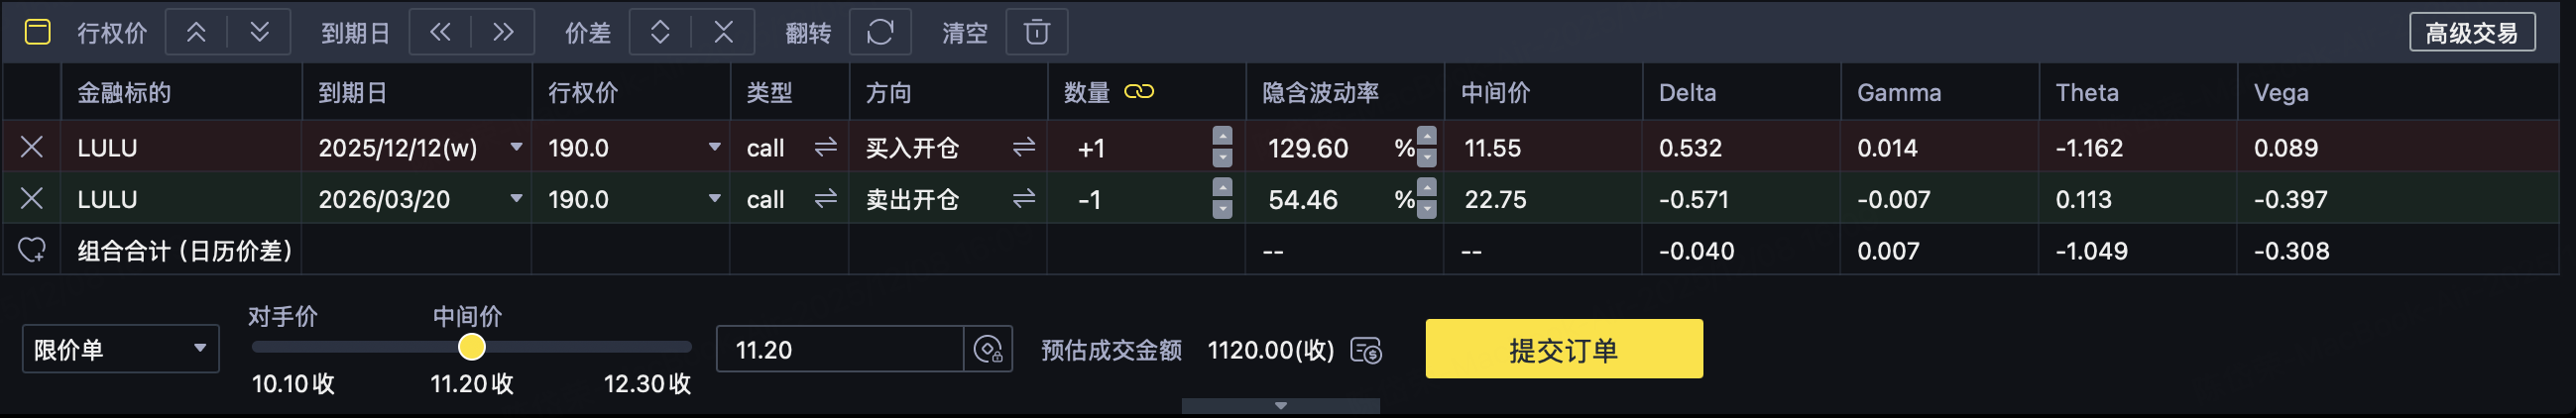
Reverse calendar spread short lulu volatility
BUYDue 12/12/2025ATM Call, price11.31
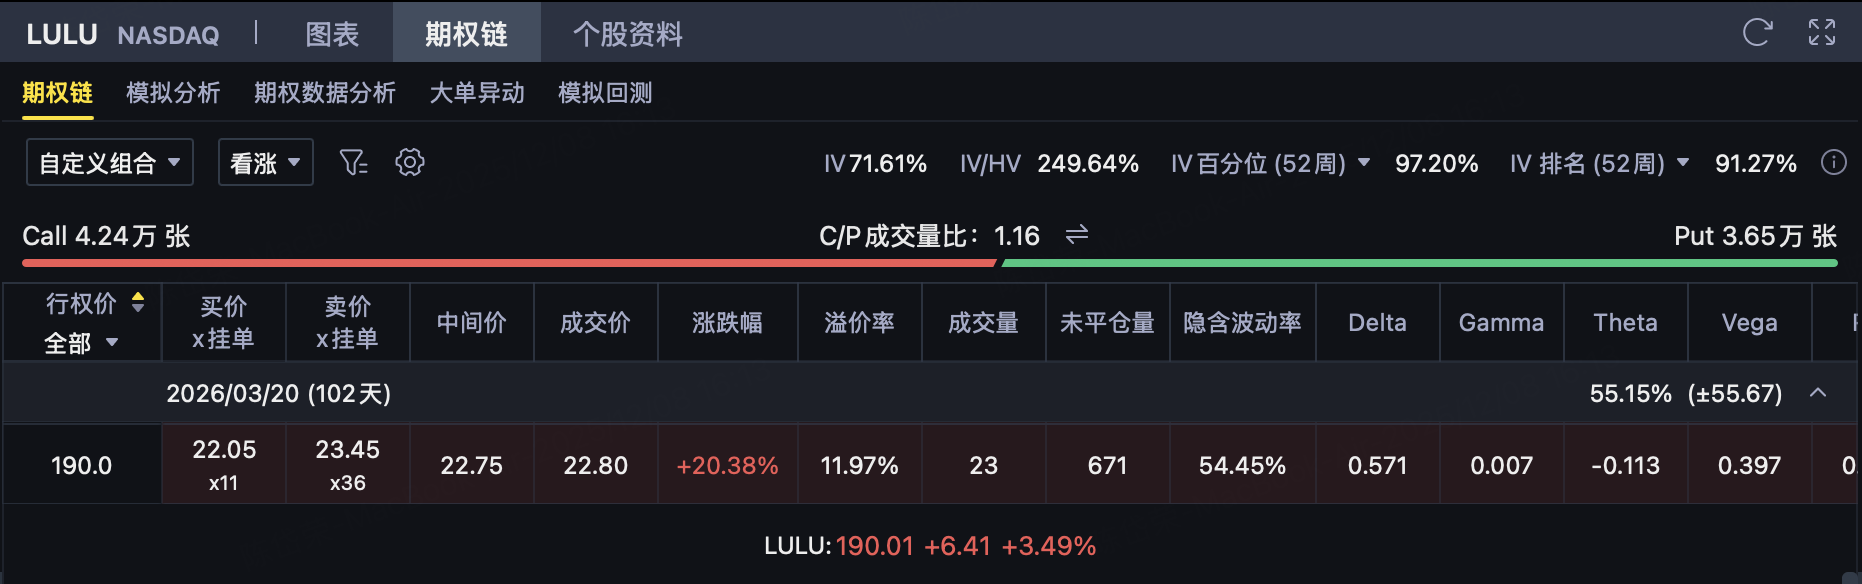
SellDue on 2026/03/20ATM Call, price22.80
The strike price of the two is the same (ATM), which consists of:
Long Near-term Call + Short Long-term Call→ Reverse Calendar Spread Reverse Calendar Spread)
The resulting combination Greeks is:
Delta =-0.04 (near neutral)
Gamma = +0.007 (positive Gamma)
Theta =-1.049 (negative Theta)
Vega =-0.308 (short Vega)
1. The essence of strategy
As the financial report is about to be announced, the IV of short-term options is at a high level, and after the financial report lands, the short-term IV tends to fall rapidly.
In this case, the investor adopts:
Buy short-cycle Call→ Seize short-term volatility opportunities
Sell long-term Call→ Hedge against time loss and take advantage of the relatively higher value of long-term IV
The starting point of the strategy is:
It is expected that the financial report will bring violent fluctuations in the short term, and at the same time, it is believed that the long-term uncertainty is not as exaggerated as the short
Therefore, investors bear limited Theta losses, but get exposure to the fluctuation difference between Gamma and term structure.
2. Profit and loss driving logic (combined with typical trends after financial reports)
Stock Price Volatility: Rapid Post-Earnings Movement Is Best for Investors (Positive Gamma)
Due to the positive Gamma, the rapid upward rush or downward kill caused by the financial report will make the portfolio profitable quickly.
No matter the direction:
If the stock price rises sharply: Short-term Call's gains usually outpace forward Call's gains
If the stock price falls sharply: Forward Call depreciates faster, beneficial to the net value of the portfolio
Hence:
After the financial report is announced, the stock price goes out of a "unilateral big move", which is the most ideal scenario for this strategy.
Time Factor: Waiting Cost Before Earnings (Negative Theta)
The combination losses about $1.05 per day, which reflects:
Time lapse drags down portfolio until Thursday earnings
But earnings-driven volatility is often more than enough to make up for this loss
The strategy essentially uses a smaller "time cost" in exchange for a larger "event fluctuation potential".
Implied Volatility: Short-term IV pullback after earnings is good for portfolio (Short Vega)
Vega of-0.308 indicates that the overall combination isShort-term hidden waves, multi-short-term hidden waves, but because I bought a short-term Call, the Vega itself is smaller, so the overall situation is stillShort Vega。
In the context of financial reports, the path of hidden waves is usually as follows:
Pre-earnings IV is high
IV dropped sharply after the financial report landed
This largeIV Crush is beneficial to investors instead because:
The far-month Call Vega sold is large, and the price drops more obviously when IV falls
The recent-month Call Vega bought is small and less affected
The portfolio therefore benefits as a whole
Therefore, the hidden wave collapse after the financial report is one of the expected sources of income for this strategy.
3. The situation where the strategy is most likely to make a profit at the current point in time
Investors will clearly benefit when:
Fast and noticeable one-way moves in the share price after earnings
The faster and more vigorous, the more advantageous the combination.
Short-term implied volatility fell rapidly after financial report
The value of far-month options sold dropped faster.
Financial reports trigger short-term uncertainty, but market expectations for long-term risks are stable
The term structure favors an inverse calendar spread.
4. Strategic risks: situations that investors should pay attention to
The following scenarios may bring losses:
The stock price doesn't move or fluctuates little after the earnings report
Gamma advantage cannot be reflected
Time decay continuous erosion combination
Long-term implied volatility rises
The value of the far-month Call sold rises → the portfolio is damaged
Stock Gains Slowly, Modestly After Earnings
Far-month Call followed the rise more obviously
Insufficient to offset time loss and hidden wave variation
Not Enough Volatility in Days Ahead of Earnings
Negative Theta causes certain costs
Comments