$NVDA
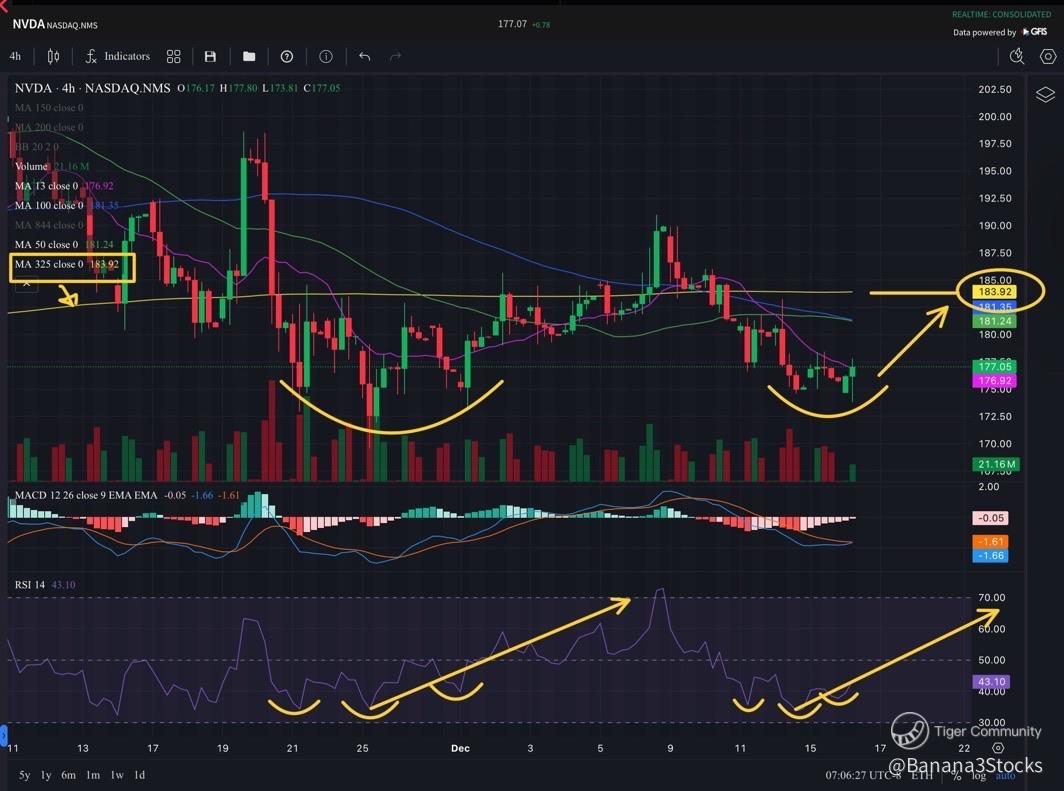
NVDA - 4hr chart analysis 💛
🎯$183 👀
I’m targeting the Banana325SMA 😘 at $183
RSI has it an extreme low where previous bounces have occurred and similar IHS pattern as well
The entire structure has a double bottom setup as well
MACD is about to have an imminent bullish crossover and price has reacted well to that previously as well
Not financial advice!
Disclaimer: Investing carries risk. This is not financial advice. The above content should not be regarded as an offer, recommendation, or solicitation on acquiring or disposing of any financial products, any associated discussions, comments, or posts by author or other users should not be considered as such either. It is solely for general information purpose only, which does not consider your own investment objectives, financial situations or needs. TTM assumes no responsibility or warranty for the accuracy and completeness of the information, investors should do their own research and may seek professional advice before investing.
Comments