Last Friday (January 31), gold and silver $白银主连 2603(SImain)$ $迷你白银主连 2603(QImain)$ $白银2603(SI2603)$ suffered a historic crash—leaving countless traders wondering: Is this a golden “buy-the-dip” opportunity, or just the beginning of a deeper sell-off? Especially now that gold has started rebounding over the past couple of days, FOMO is kicking in hard. $黄金主连 2604(GCmain)$ $微黄金主连 2604(MGCmain)$ $1盎司黄金主连 2604(1OZmain)$ $富兰克林黄金及贵金属基金A (acc)USD(LU0496367417.USD)$
But instead of guessing on your own or getting lost in the sea of online noise, let’s turn to the most reliable source: the latest CFTC Commitments of Traders (COT) report.
Before we dive in, a quick refresher: $铜矿ETF-Global X(COPX)$ $麦克莫兰铜金(FCX)$ $南方铜业(SCCO)$
The CFTC report tracks positions in futures markets, broken down into reportable and non-reportable positions. Reportable positions are further split into:
-
Commercial positions: Held by industry players like miners, smelters, and manufacturers—essentially “real economy” hedgers.
-
Non-commercial positions: Held by speculators such as hedge funds and asset managers.
-
Non-reportable positions: Small-scale traders (often retail).
Now, if you could only watch one piece of data in the CFTC report, what should it be? $白银主连 2603(SImain)$ $迷你白银主连 2603(QImain)$ $白银2603(SI2603)$
Answer: Non-commercial positions.
Why? Because these reflect the moves of Wall Street’s big players—hedge funds, institutional asset managers—who often lead trends, position early, and manage risk proactively. Their behavior offers one of the clearest windows into market sentiment and directional bias.
The latest CFTC data was released last Saturday (January 31, Beijing time), but keep in mind: the figures are as of the previous Tuesday due to reporting lags. So while the data isn’t real-time, when combined with current price action, it helps us form a forward-looking, fundamentals-based view—not just short-term, emotional trading.
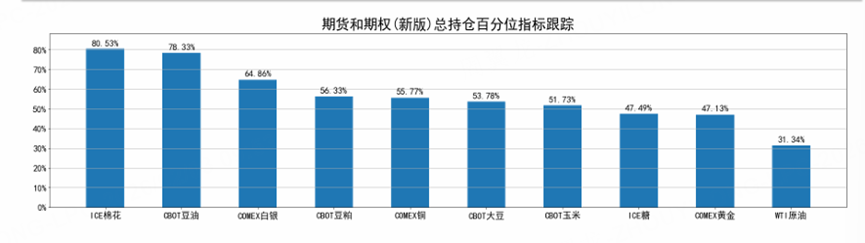
As in our previous analysis, we start with the Total Open Interest Percentile—a gauge of overall market interest in a commodity (higher = hotter). Note: this metric doesn’t predict price direction, but it does show which markets are primed for potential moves.$铜矿ETF-Global X(COPX)$ $麦克莫兰铜金(FCX)$ $南方铜业(SCCO)$
From the chart below, it’s clear: cotton and soybean oil are currently the hottest commodities in terms of trader attention. $彭博棉花分类指数总收益ETN-iPath(BALTF)$ $豆油主连 2603(ZLmain)$ $豆油2603(ZL2603)$
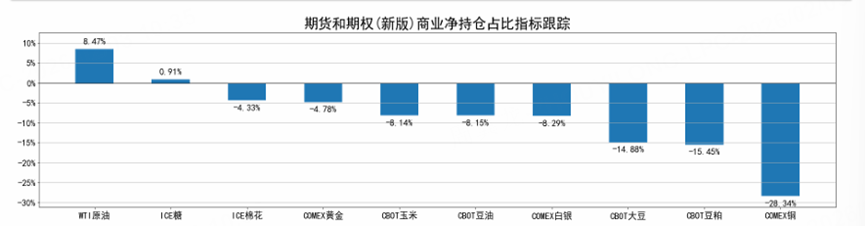
Now let’s look at the commercial net position ratio. As mentioned earlier, this refers to positions held by miners, smelters, traders, and other commercial entities for hedging purposes. They have genuine trading needs and often hold physical inventory, so they typically go short to hedge risk.
As we can see from the chart, their net positions are consistently net-short over the long term (i.e., long-term net short > 0). When industrial capital starts going long, it can be seen as an outlier—often signaling that prices have already hit a bottom. For example, if even cotton producers are hoarding and buying cotton futures, doesn’t that clearly indicate cotton prices are very low?$铜矿ETF-Global X(COPX)$ $麦克莫兰铜金(FCX)$ $南方铜业(SCCO)$
Looking at the data, let’s focus on copper: copper’s commercial net position is negative and has a large absolute value, indicating that commercial entities believe current prices are relatively high, so they are hedging by selling futures to manage risk. $黄金主连 2604(GCmain)$ $微黄金主连 2604(MGCmain)$ $1盎司黄金主连 2604(1OZmain)$ $富兰克林黄金及贵金属基金A (acc)USD(LU0496367417.USD)$
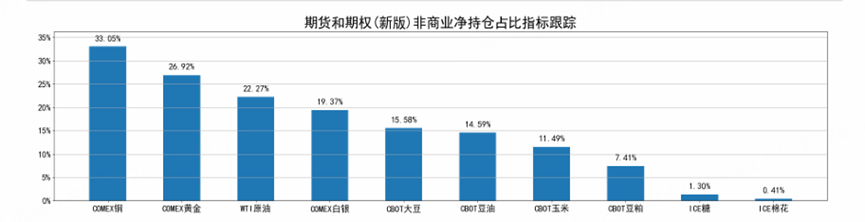
But this only reflects the view of commercial entities. Now let’s see what the big hedge funds and other speculative institutions think.
We can clearly see that copper and gold have very large absolute values in their non-commercial position ratios, indicating that institutional investors are broadly holding net long positions—showing a bullish market sentiment. In other words, the market was still bullish on copper and gold.$铜矿ETF-Global X(COPX)$ $麦克莫兰铜金(FCX)$ $南方铜业(SCCO)$
But you might ask: didn’t gold just crash? Why is the sentiment still bullish?
The reason is that CFTC data is released every Saturday (Beijing time), and it reflects positions as of the preceding Tuesday. So last Tuesday, when the data was recorded, the market was indeed still bullish on gold—which aligns perfectly with gold’s price action at that time.$铜矿ETF-Global X(COPX)$ $麦克莫兰铜金(FCX)$ $南方铜业(SCCO)$
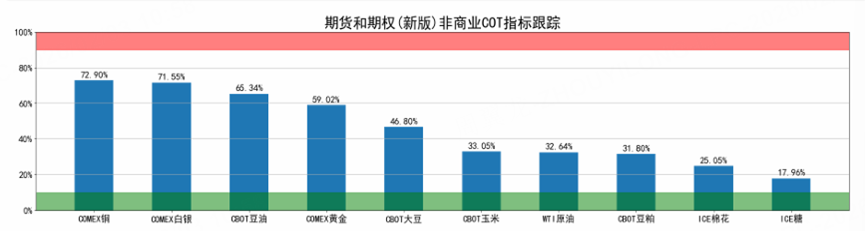
Now let’s look at the non-commercial COT indicator.
The COT indicator is calculated as:
(This week’s fund net position – the lowest fund net position over the past three years) / (the highest fund net position over the past three years – the lowest over the same period) × 100%.
A reading between 90% and 100% indicates an overbought market, while a reading between 0% and 10% signals an oversold market.
However, its practical reference value is limited, because during strong bull or bear markets, the COT indicator tends to become blunted—it can stay in extreme zones for extended periods without clear timing signals for reversals. Therefore, it primarily serves as a risk warning tool rather than a precise trading signal.
The higher the value—especially when it enters the red zone—the more overbought the market is; the lower the value—particularly when it reaches the green zone—the more oversold the market becomes.
Currently, no commodity shows an anomalous COT reading.
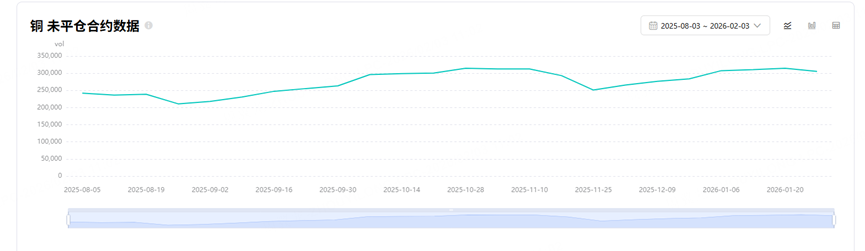
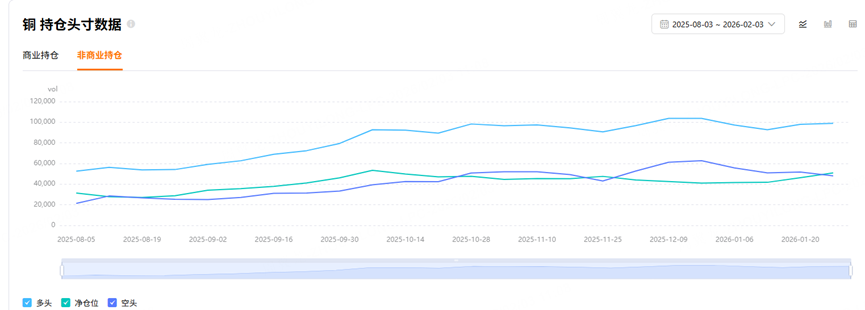
Finally, let’s focus solely on copper futures. These two charts can be discussed together..$铜矿ETF-Global X(COPX)$ $麦克莫兰铜金(FCX)$ $南方铜业(SCCO)$
Open interest (OI) in the copper futures market has been steadily rising since the second half of 2025 and remained at elevated levels from late 2025 through early 2026, indicating high market participation, increased speculative activity, and intense long-short positioning—placing the market firmly in the mid-to-late stage of a trend-driven rally.
OI is now in a historically high range (approaching 300,000 contracts). If prices fail to make new highs going forward, this could trigger a wave of forced liquidations or a “run on the bank”-style unwinding of positions.
The second chart shows that although copper prices have risen, the momentum from new buying has weakened—potentially signaling that the rally is entering its final phase..$铜矿ETF-Global X(COPX)$ $麦克莫兰铜金(FCX)$ $南方铜业(SCCO)$
However, copper’s current situation is underpinned by both high inventories and high expectations. Therefore, the key question is whether these inventory builds and bullish expectations can actually be realized.
We cannot rely on data alone; a comprehensive assessment must also incorporate fundamental factors..$铜矿ETF-Global X(COPX)$ $麦克莫兰铜金(FCX)$ $南方铜业(SCCO)$
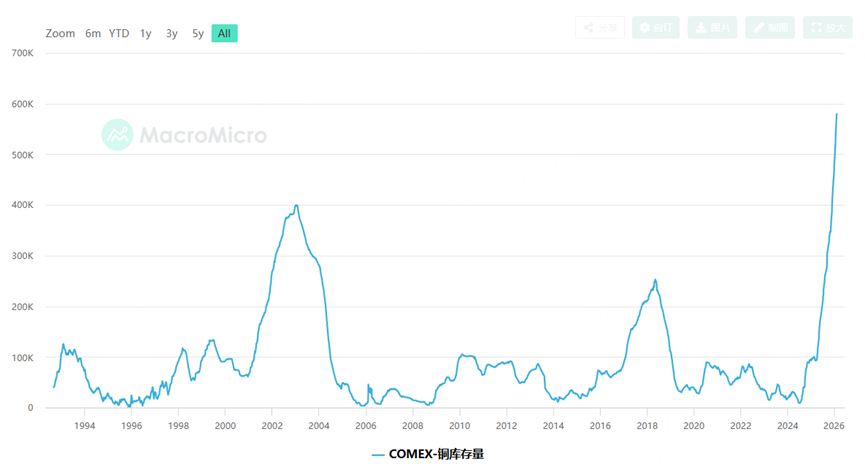
COMEX copper inventories surged sharply in 2025–2026, breaking through historical highs. This suggests the market is experiencing significant physical supply tightness or strategic stockpiling, which could foreshadow heightened price volatility ahead.
Let’s review the historical context of COMEX copper inventory changes:
-
1994–2003: Inventories remained relatively stable with minor fluctuations.
-
2003 peak (around 4,000 metric tons): Coincided with accelerated global industrialization and China’s post-WTO infrastructure boom, which drove copper prices sharply higher—though supplies later increased, causing prices to retreat.
-
2018 mini-peak (about 2,500 tons): Reflected a temporary demand rebound during the global economic recovery.
-
2020–2024: Inventories stayed low (typically below 1,000 tons), indicating a prolonged state of “low inventory, high liquidity” — a tight market equilibrium.
Starting in 2025, inventories began to climb, and by 2026, they surpassed the 5,000-ton mark. This buildup stems partly from strategic hoarding in anticipation of tariffs and other geopolitical risks, and partly from surging demand driven by the energy transition. Meanwhile, on the supply side—factors like strikes, mine accidents, and environmental restrictions—could have even more lasting impacts on copper’s future trajectory.
Let’s now supplement with recent fund flow data for gold, silver, and copper, sourced from Wind.
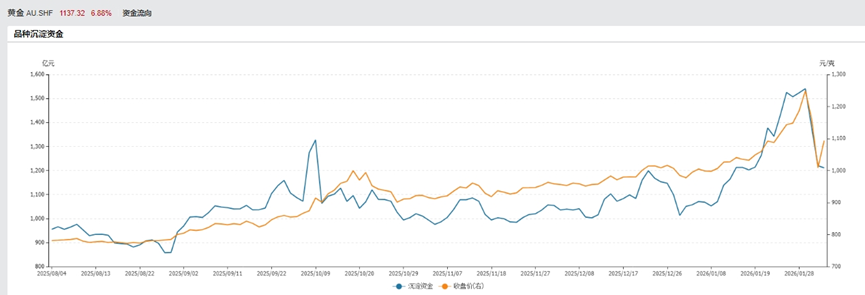
First, gold.$黄金主连 2604(GCmain)$ $微黄金主连 2604(MGCmain)$ $1盎司黄金主连 2604(1OZmain)$ $富兰克林黄金及贵金属基金A (acc)USD(LU0496367417.USD)$
After the sharp plunge in gold and silver on January 28, gold prices started rising again today. Whether this is a genuine “buy-the-dip” opportunity or just a brief bounce is hard to judge—readers may refer to Owen’s article for further perspective.
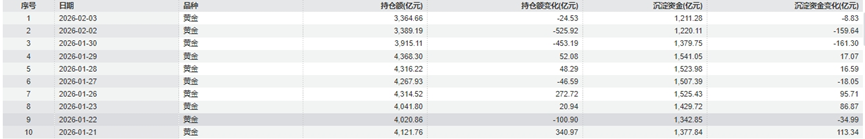
In the chart below, “settled capital” (or “locked-in margin”) is calculated as:
Total open interest × exchange-mandated margin requirement per contract.
Simply put, it represents the total margin posted by all futures traders in the market.
We can see that although gold prices are rebounding, the settled capital continues to decline—indicating that major players are still exiting positions.
In trading psychology, when prices rise while settled capital sharply drops, it’s typically interpreted as either short-covering or long liquidation—meaning the rally isn’t driven by strong new buying, but rather by traders rushing to close out positions and exit the market.
Looking specifically at domestic gold futures, the decline in settled capital clearly shows a tide of capital outflow. Starting January 30, the market experienced significant net fund outflows for two consecutive days, with over RMB 30 billion in settled capital evaporating. As of February 3, fund flows remain negative.
This confirms that the current rally lacks support from fresh capital inflows, and institutional players are decisively withdrawing—validating the view that this rebound is an opportunity to reduce positions, not to add them.$黄金主连 2604(GCmain)$ $微黄金主连 2604(MGCmain)$ $1盎司黄金主连 2604(1OZmain)$ $富兰克林黄金及贵金属基金A (acc)USD(LU0496367417.USD)$
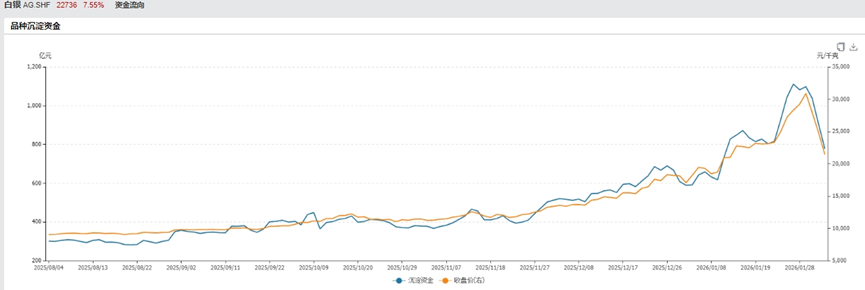
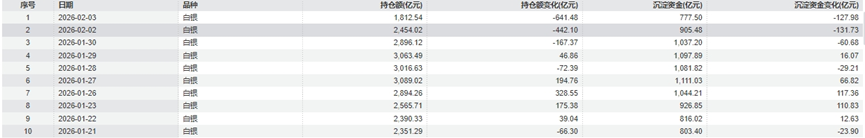
Now let’s look at silver. $白银主连 2603(SImain)$ $迷你白银主连 2603(QImain)$ $白银2603(SI2603)$
According to the settled capital data, silver has taken a far heavier hit than gold. On February 3 alone, RMB 12.8 billion flowed out of silver futures—accounting for 16.5% of its total capital pool, which is more than 20 times greater than the outflow seen in gold on a relative basis.
As many analyses have already pointed out, this crash was primarily driven by forced liquidations of highly leveraged long positions, triggering a cascade of margin calls and stop-loss selling.
Comparing silver with gold, we can see that gold’s drawdown remains relatively mild, with major players mostly taking profits at elevated levels. In contrast, silver’s capital curve has plunged off a cliff—indicating a complete collapse in long-side confidence. $白银主连 2603(SImain)$ $迷你白银主连 2603(QImain)$ $白银2603(SI2603)$
In such a state of severe capital depletion, any rebound in silver is likely to be extremely weak and easily overwhelmed by trapped longs rushing to exit again.
For now, silver does not appear to be a good candidate for bottom-fishing; it is still clearly in the midst of a risk-unwinding phase. $白银主连 2603(SImain)$ $迷你白银主连 2603(QImain)$ $白银2603(SI2603)$
Therefore, this Friday, I’ll take you through an in-depth analysis of copper..$铜矿ETF-Global X(COPX)$ $麦克莫兰铜金(FCX)$ $南方铜业(SCCO)$
Will copper enter a bull market? Could it crash like gold and silver just did?
Stay tuned for my deep-dive article coming out Friday afternoon—I’ll break down everything you need to know about copper in a clear, thorough, and easy-to-understand way..$铜矿ETF-Global X(COPX)$ $麦克莫兰铜金(FCX)$ $南方铜业(SCCO)$ $白银主连 2603(SImain)$ $迷你白银主连 2603(QImain)$ $黄金主连 2604(GCmain)$ $微黄金主连 2604(MGCmain)$ $1盎司黄金主连 2604(1OZmain)$
Comments