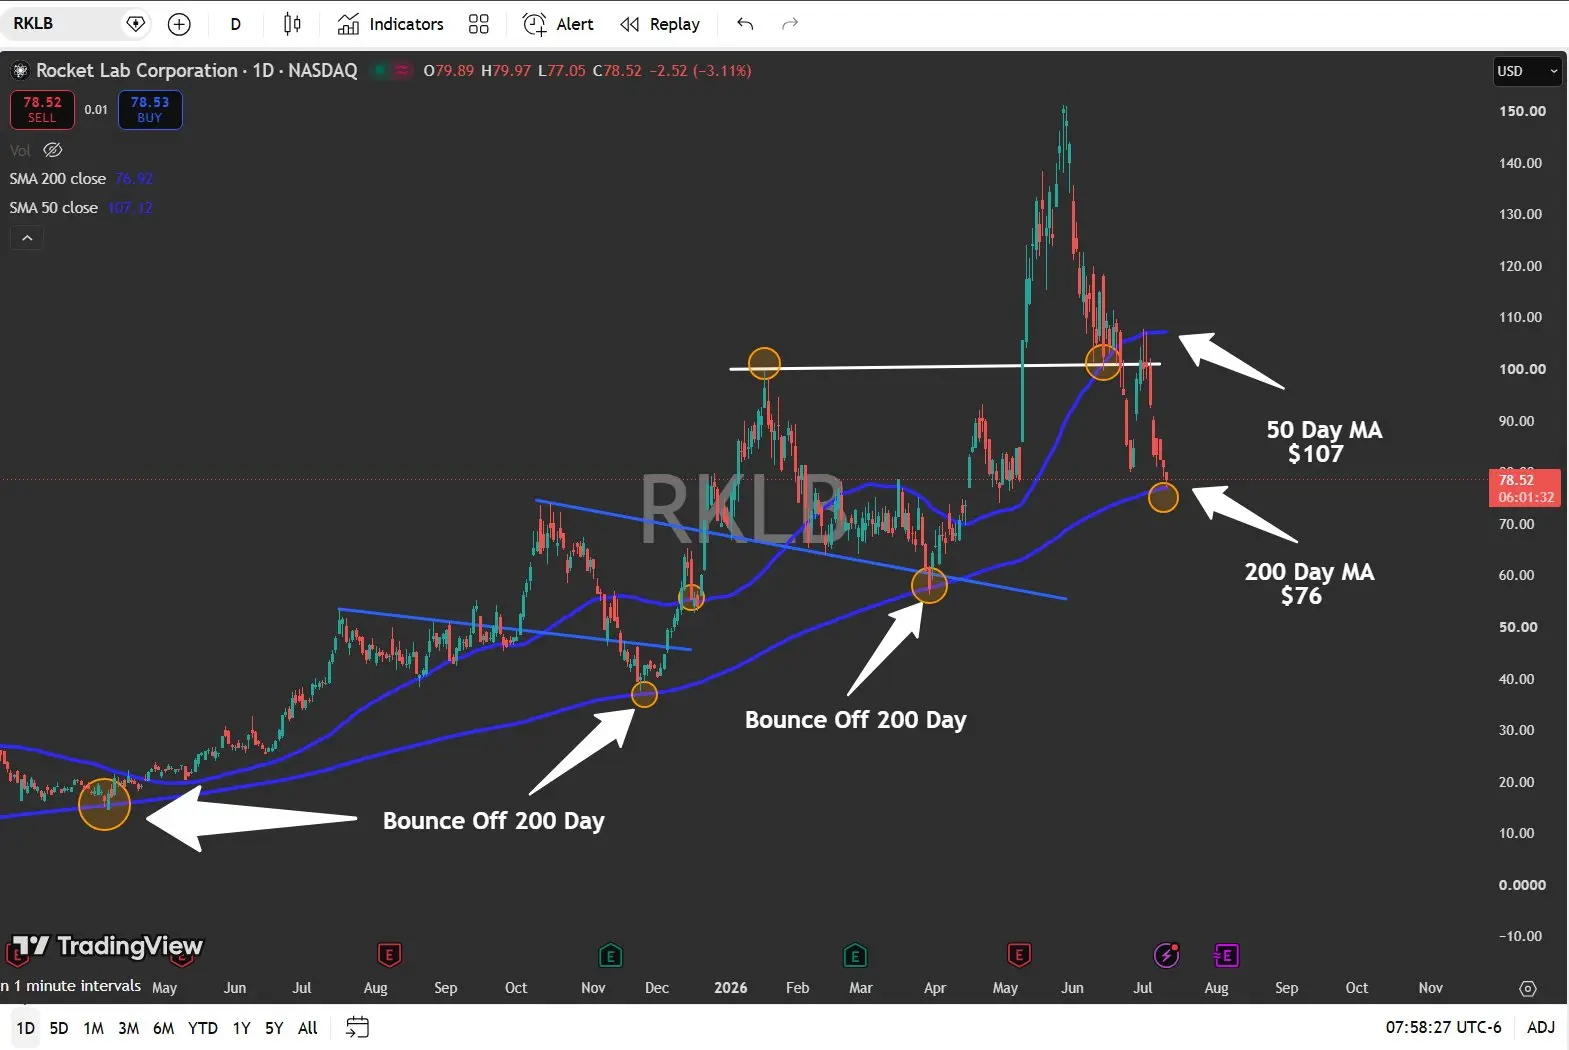
$Rocket Lab USA, Inc.(RKLB)$ One technical level on this chart that always gets my attention is the 200-day moving average.
Rocket Lab has touched it again, and historically, it's been a level worth watching. The last three times it hit the 200 MA were followed by notable rebounds:
$14.71 → $53.44 (+177%)
$37.57 → $96.30 (+183%)
$56.13 → $151.00 (+111%)
Obviously, past performance doesn't predict the future, but this is an area I'm focused on. If the 200 MA holds as support and volume picks up, the setup could become more compelling from a risk/reward perspective.
Some of the better opportunities often appear when sentiment is low.
Disclaimer: Investing carries risk. This is not financial advice. The above content should not be regarded as an offer, recommendation, or solicitation on acquiring or disposing of any financial products, any associated discussions, comments, or posts by author or other users should not be considered as such either. It is solely for general information purpose only, which does not consider your own investment objectives, financial situations or needs. TTM assumes no responsibility or warranty for the accuracy and completeness of the information, investors should do their own research and may seek professional advice before investing.
Comments