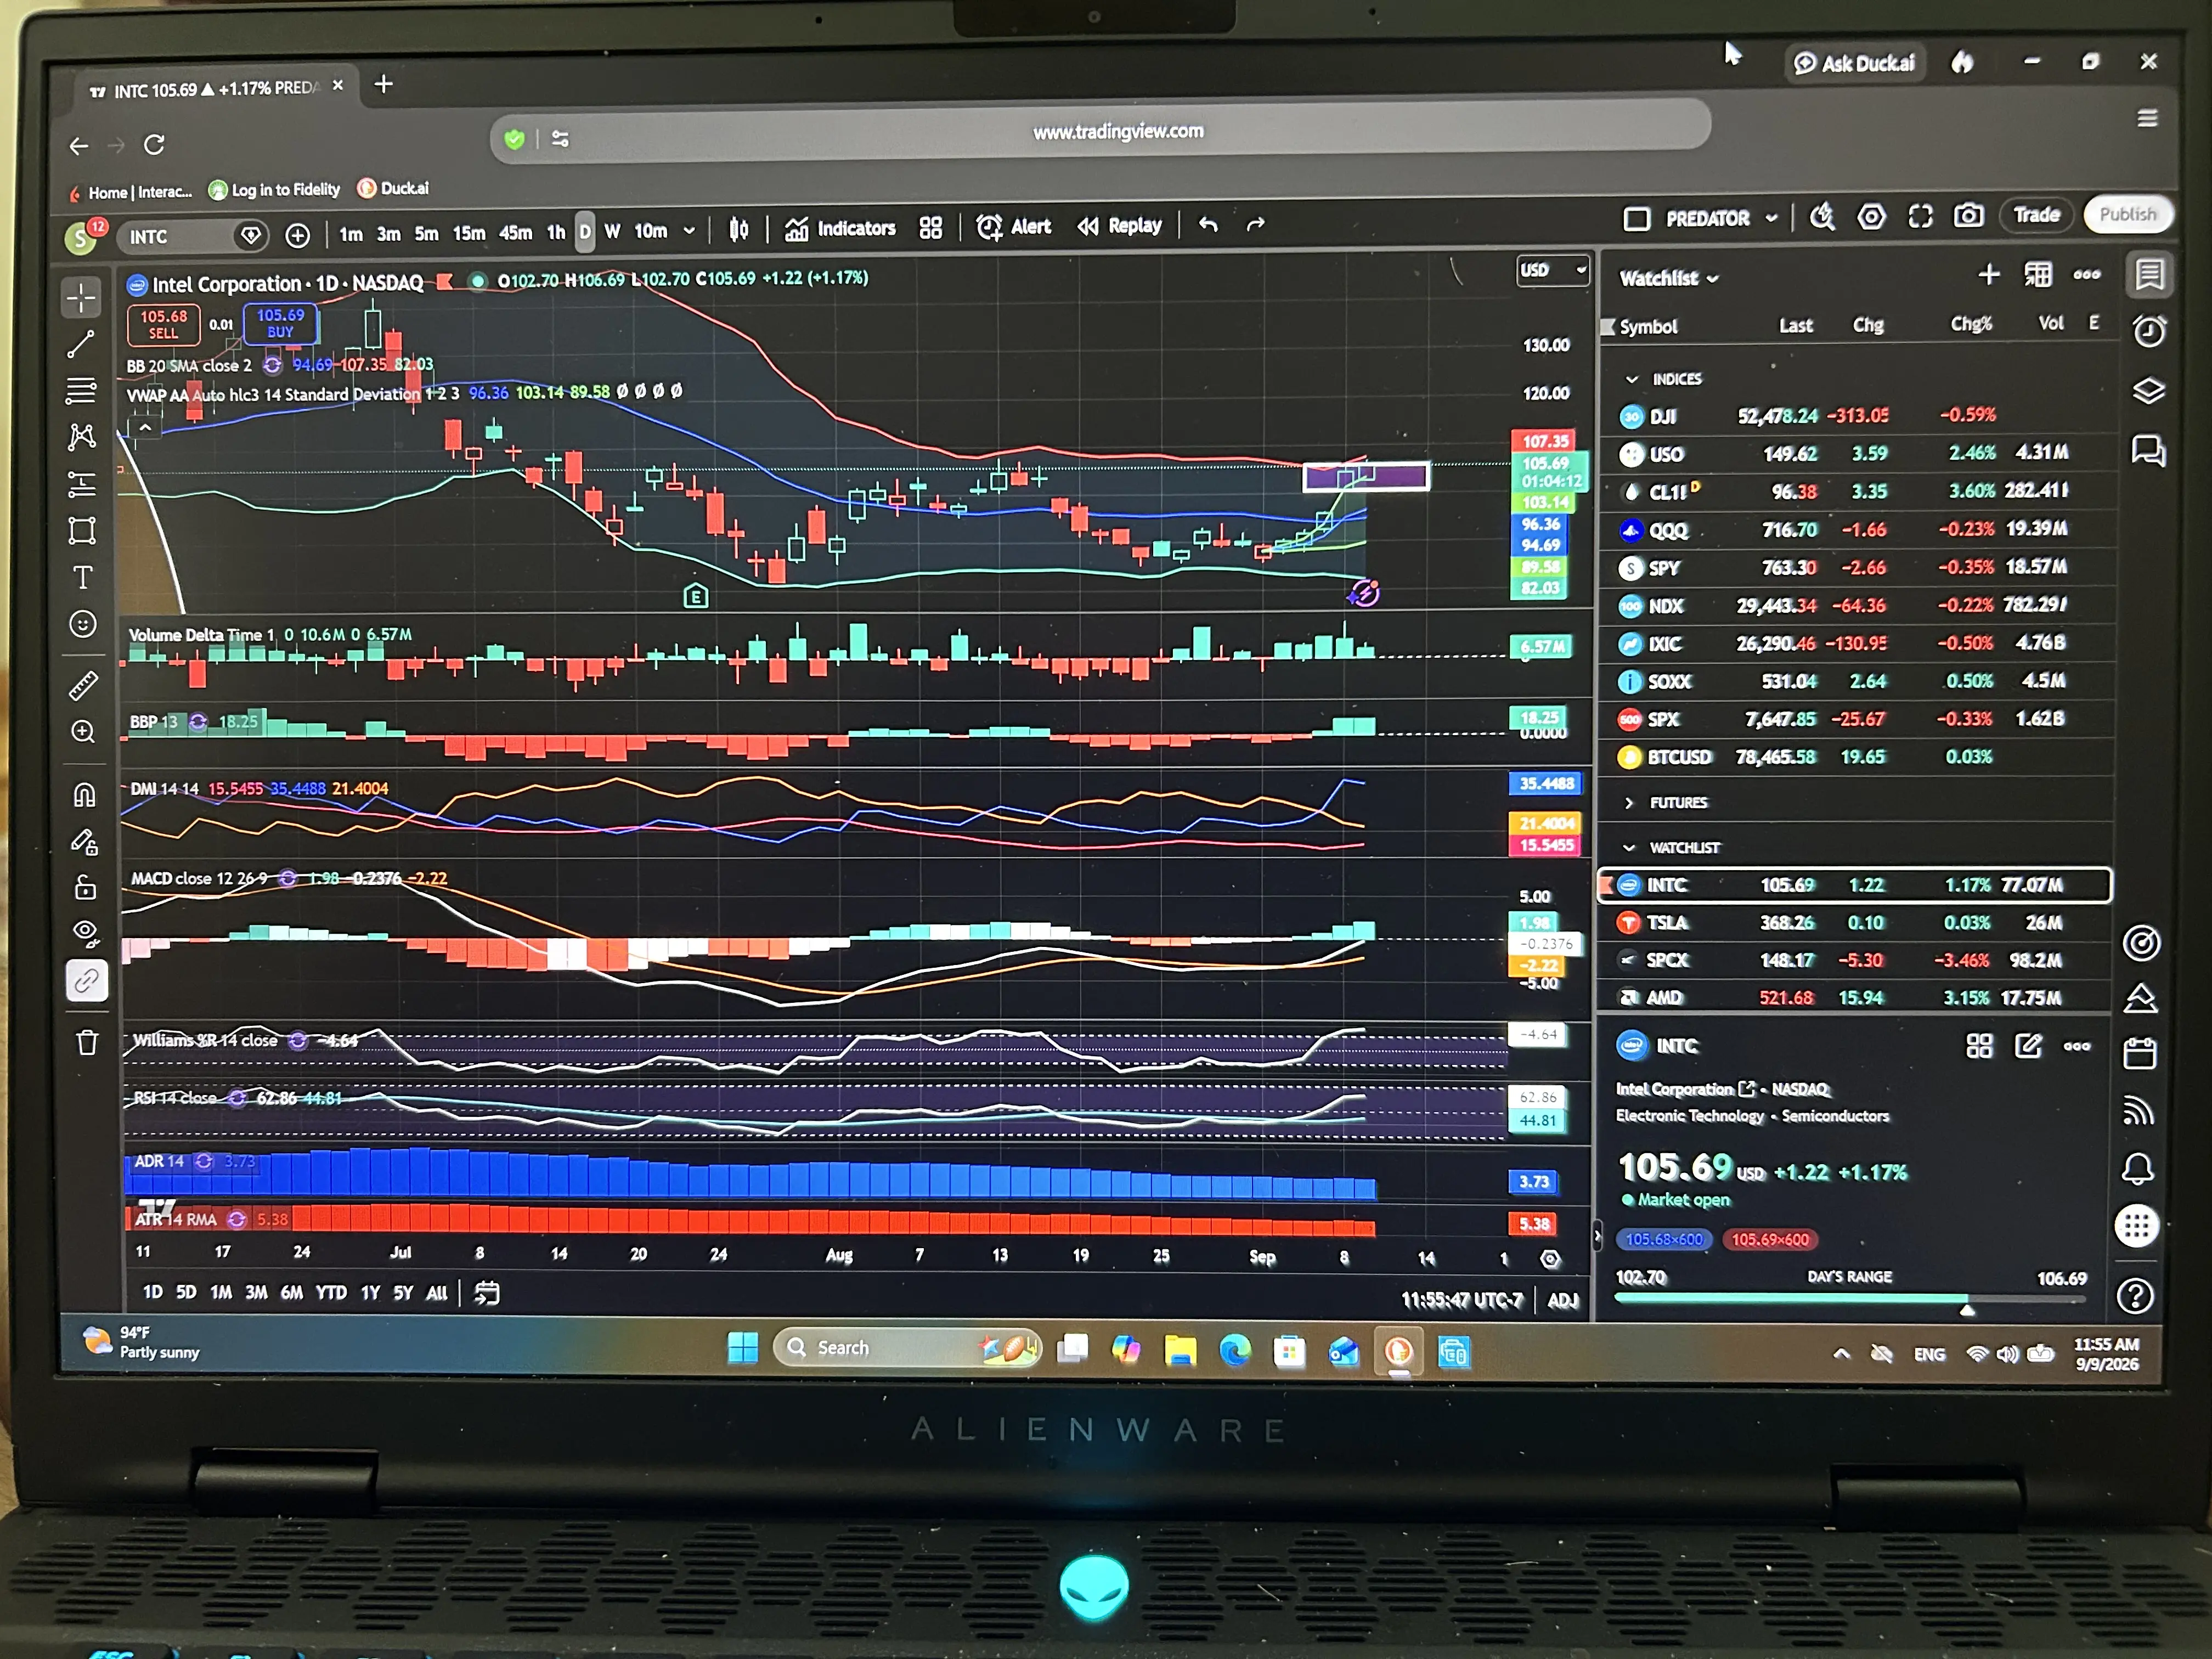
$Intel(INTC)$ Price is grinding up against the top of the daily Bollinger Band. The band is curling up and VWAPs are rising. This could result in a completion of the mean reversion trade, similar to the pattern visible on the left side of the chart. That earlier setup ran from 7.29.26 to 8.14.26 at the top, reverted back to the lower Bollinger Band by 8.24.26, then started cleanly back toward the top band on 8.26.26.
Disclaimer: Investing carries risk. This is not financial advice. The above content should not be regarded as an offer, recommendation, or solicitation on acquiring or disposing of any financial products, any associated discussions, comments, or posts by author or other users should not be considered as such either. It is solely for general information purpose only, which does not consider your own investment objectives, financial situations or needs. TTM assumes no responsibility or warranty for the accuracy and completeness of the information, investors should do their own research and may seek professional advice before investing.
Comments