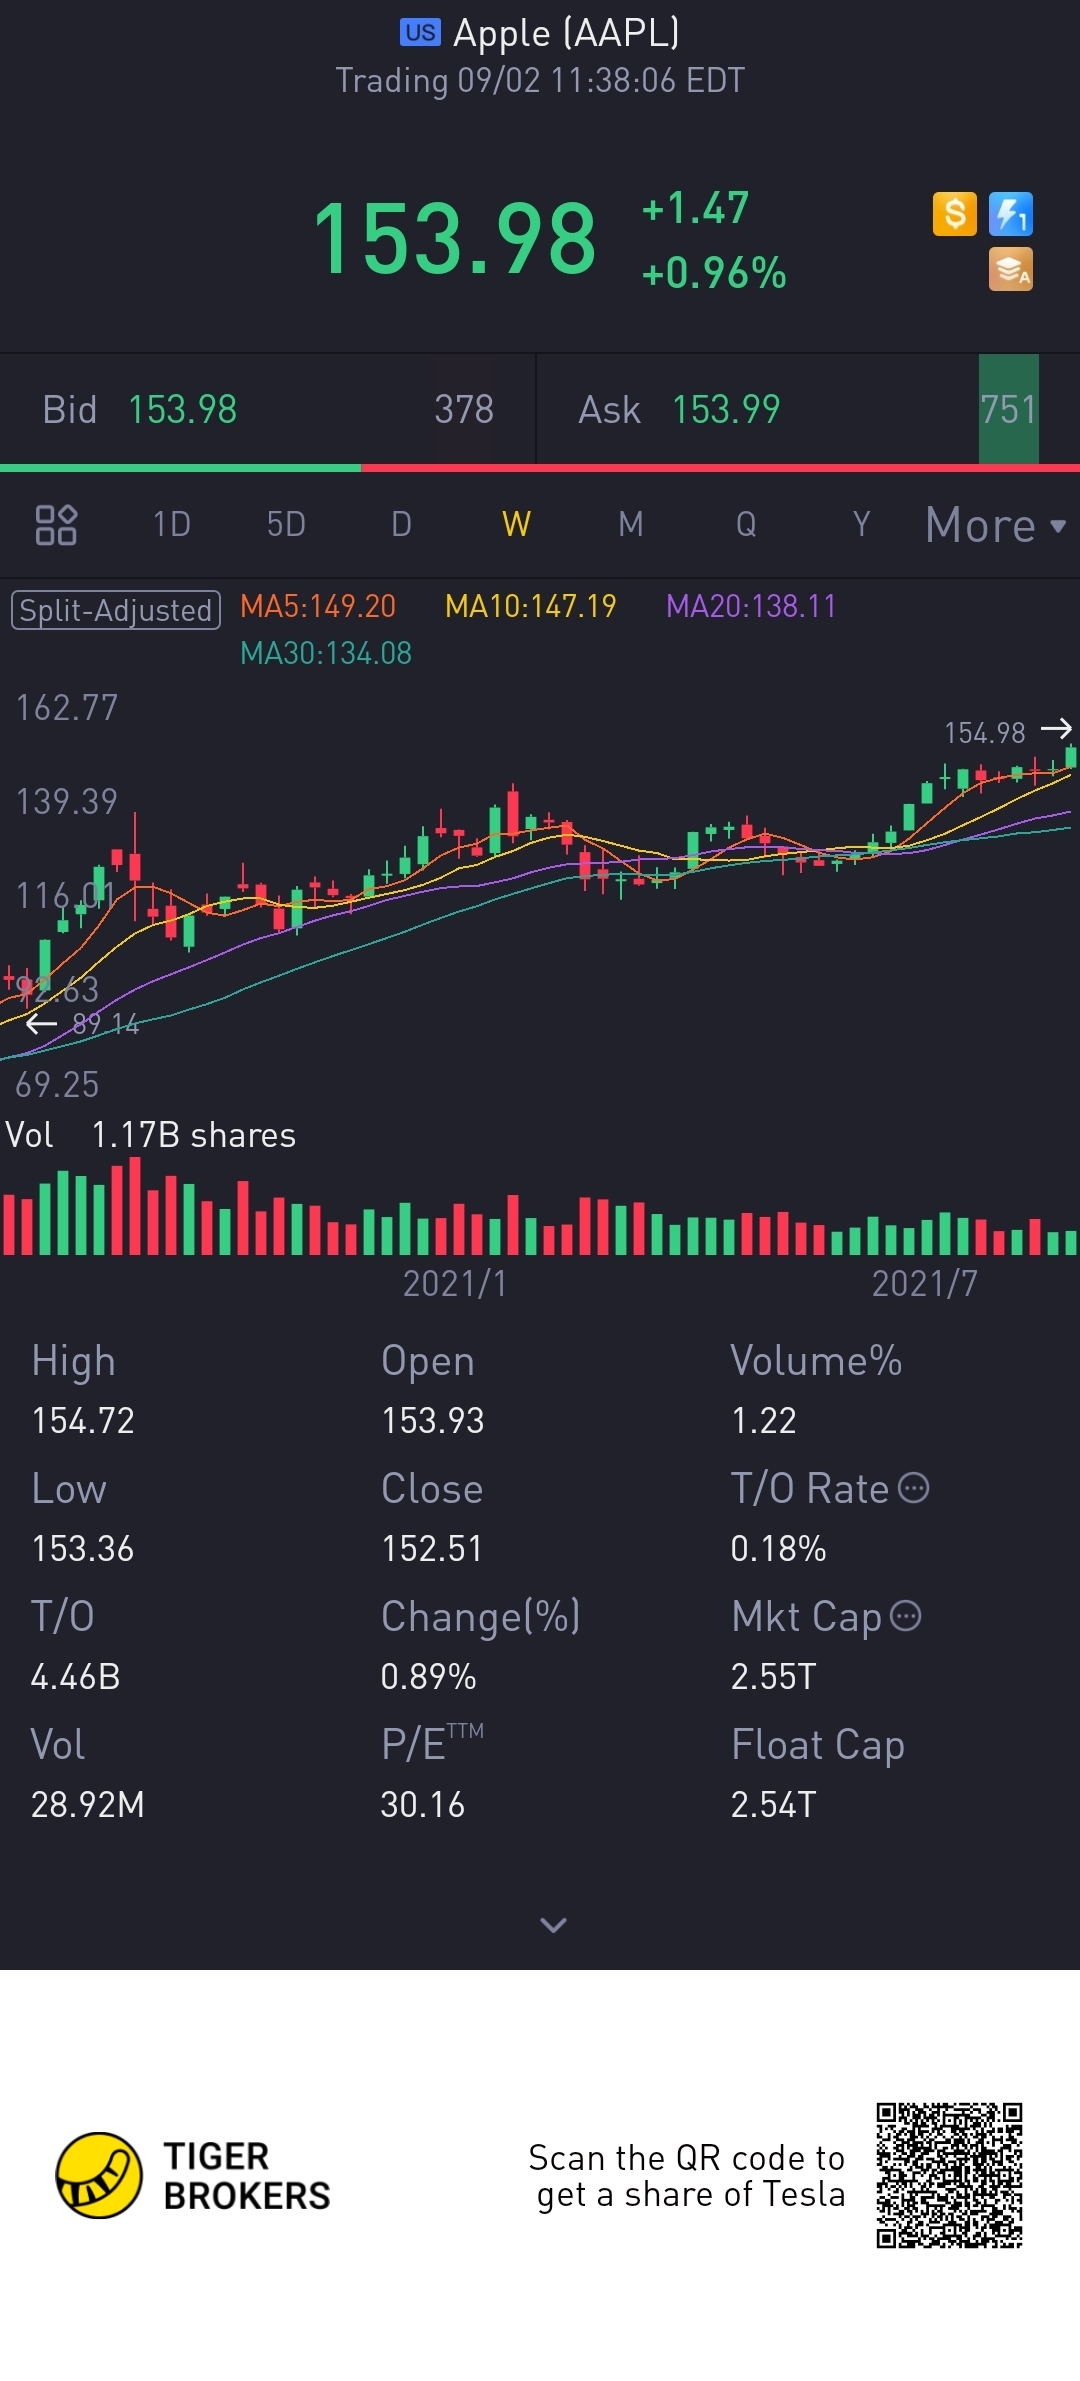
Let's do a really simple chart analysis of $Apple(AAPL)$:
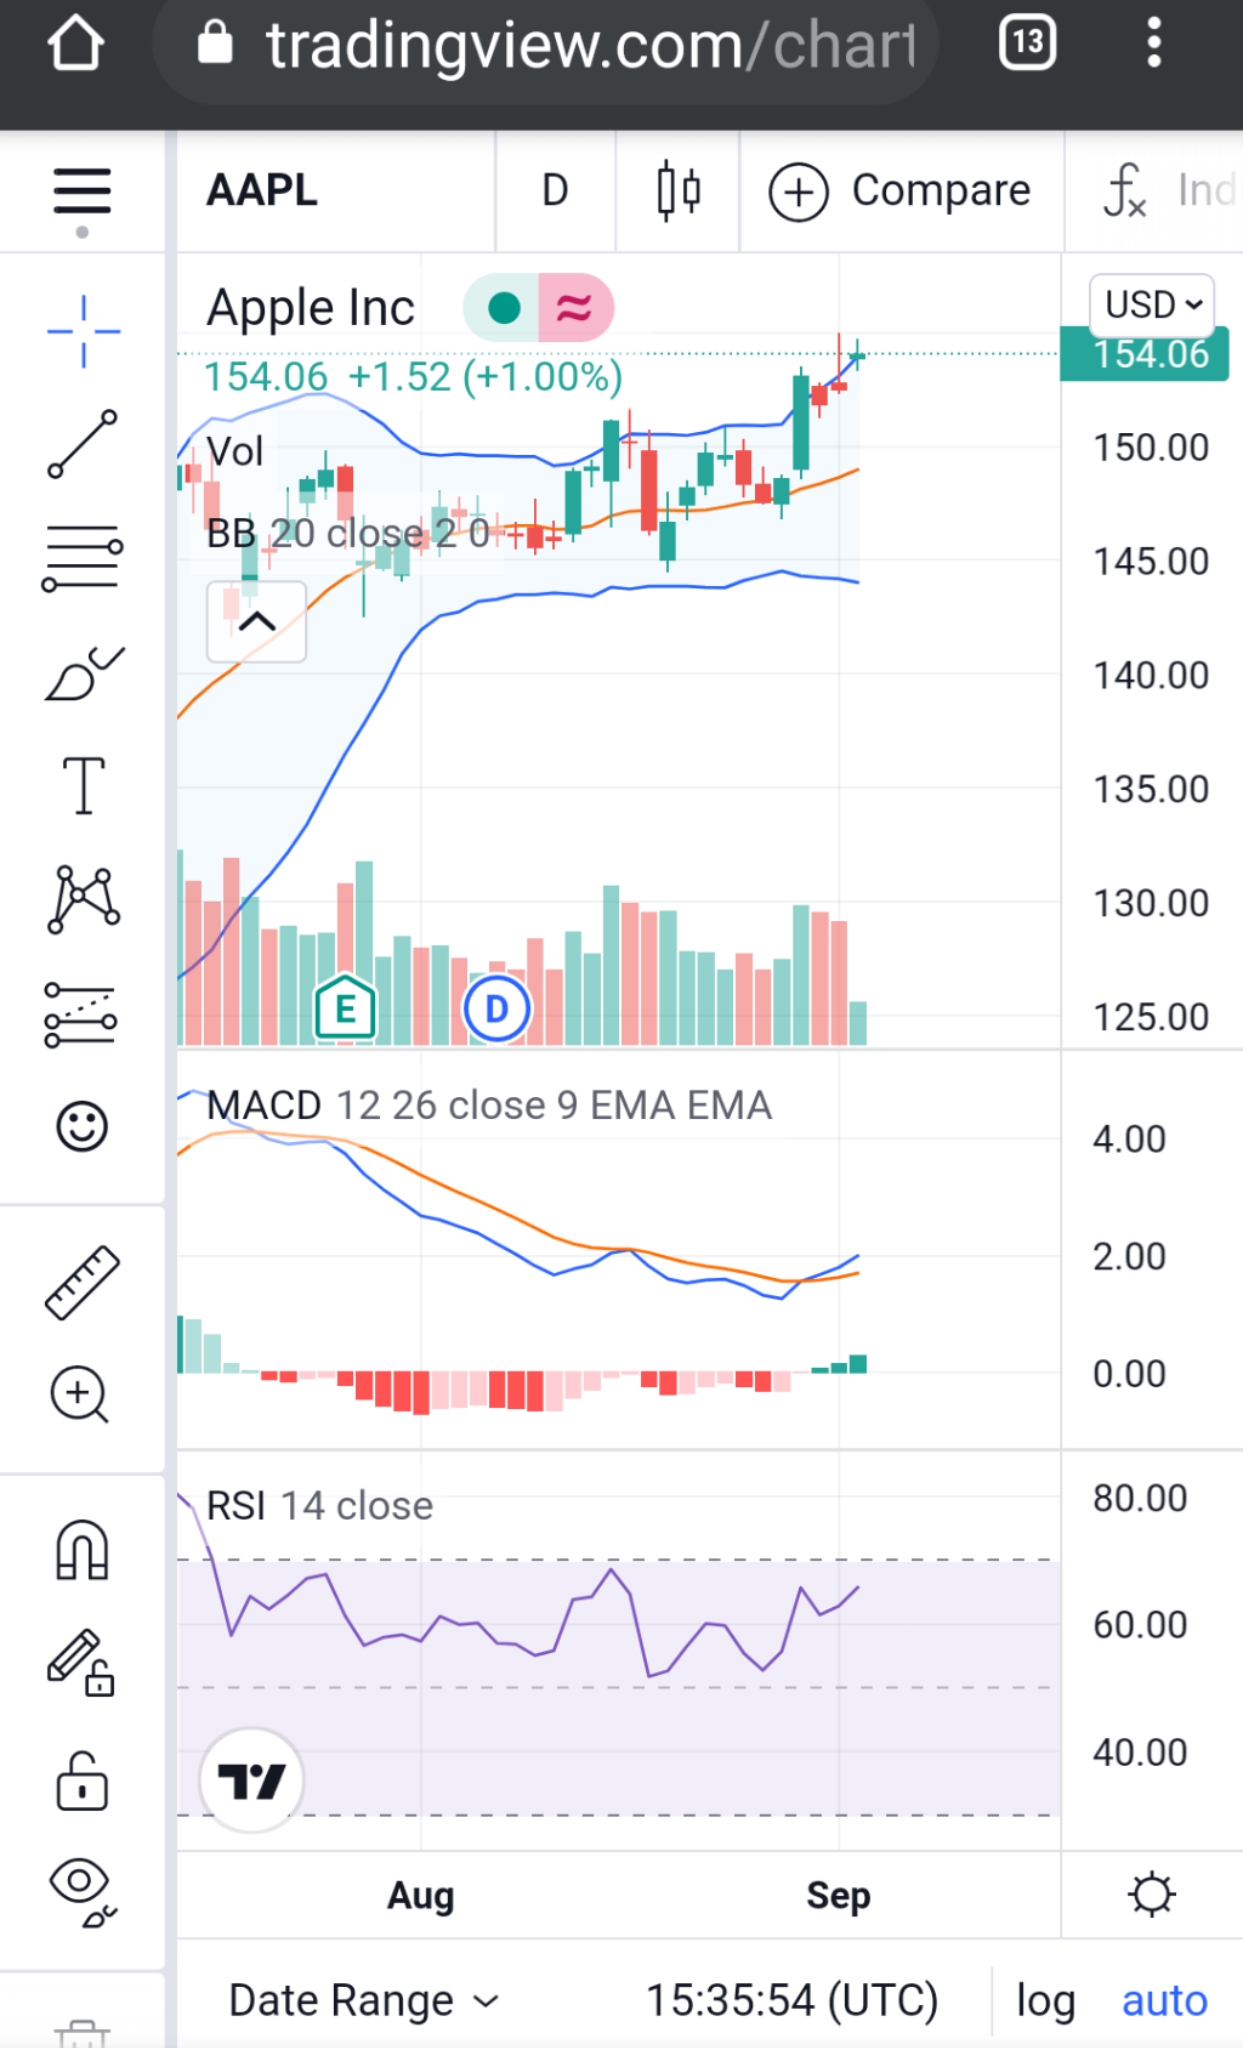
On the white chart, I'm using 3 indicators:
1) MACD
2) Bollinger bands
3) RSI
The first thing I always like to look at when reading a chart is the MACD. Because you don't really need to think so much with it. Looking at how the BLUE line clearly crosses the RED line (with the green volume charts just started rising), it's definitely good for a "BUY".
Second, although the green candlestick for the day is situated on the tip of the Bollinger band, showing that it has reach its ceiling.. but looking at the MACD line earlier, I would gladly say it has yet to really reach the "ceiling".
Finally, from the RSI indicator, though the purple line shows it's near the "top" of ceiling.. you can tell that there is still some room to go..
So based on these 3 indicators, I would think that $Apple(AAPL)$still has some growth & definitely not be going down just yet.
So $Apple(AAPL)$let's roll on ???


Comments