How to identify short-term highs and lows

LCapitaljr
2022-03-11

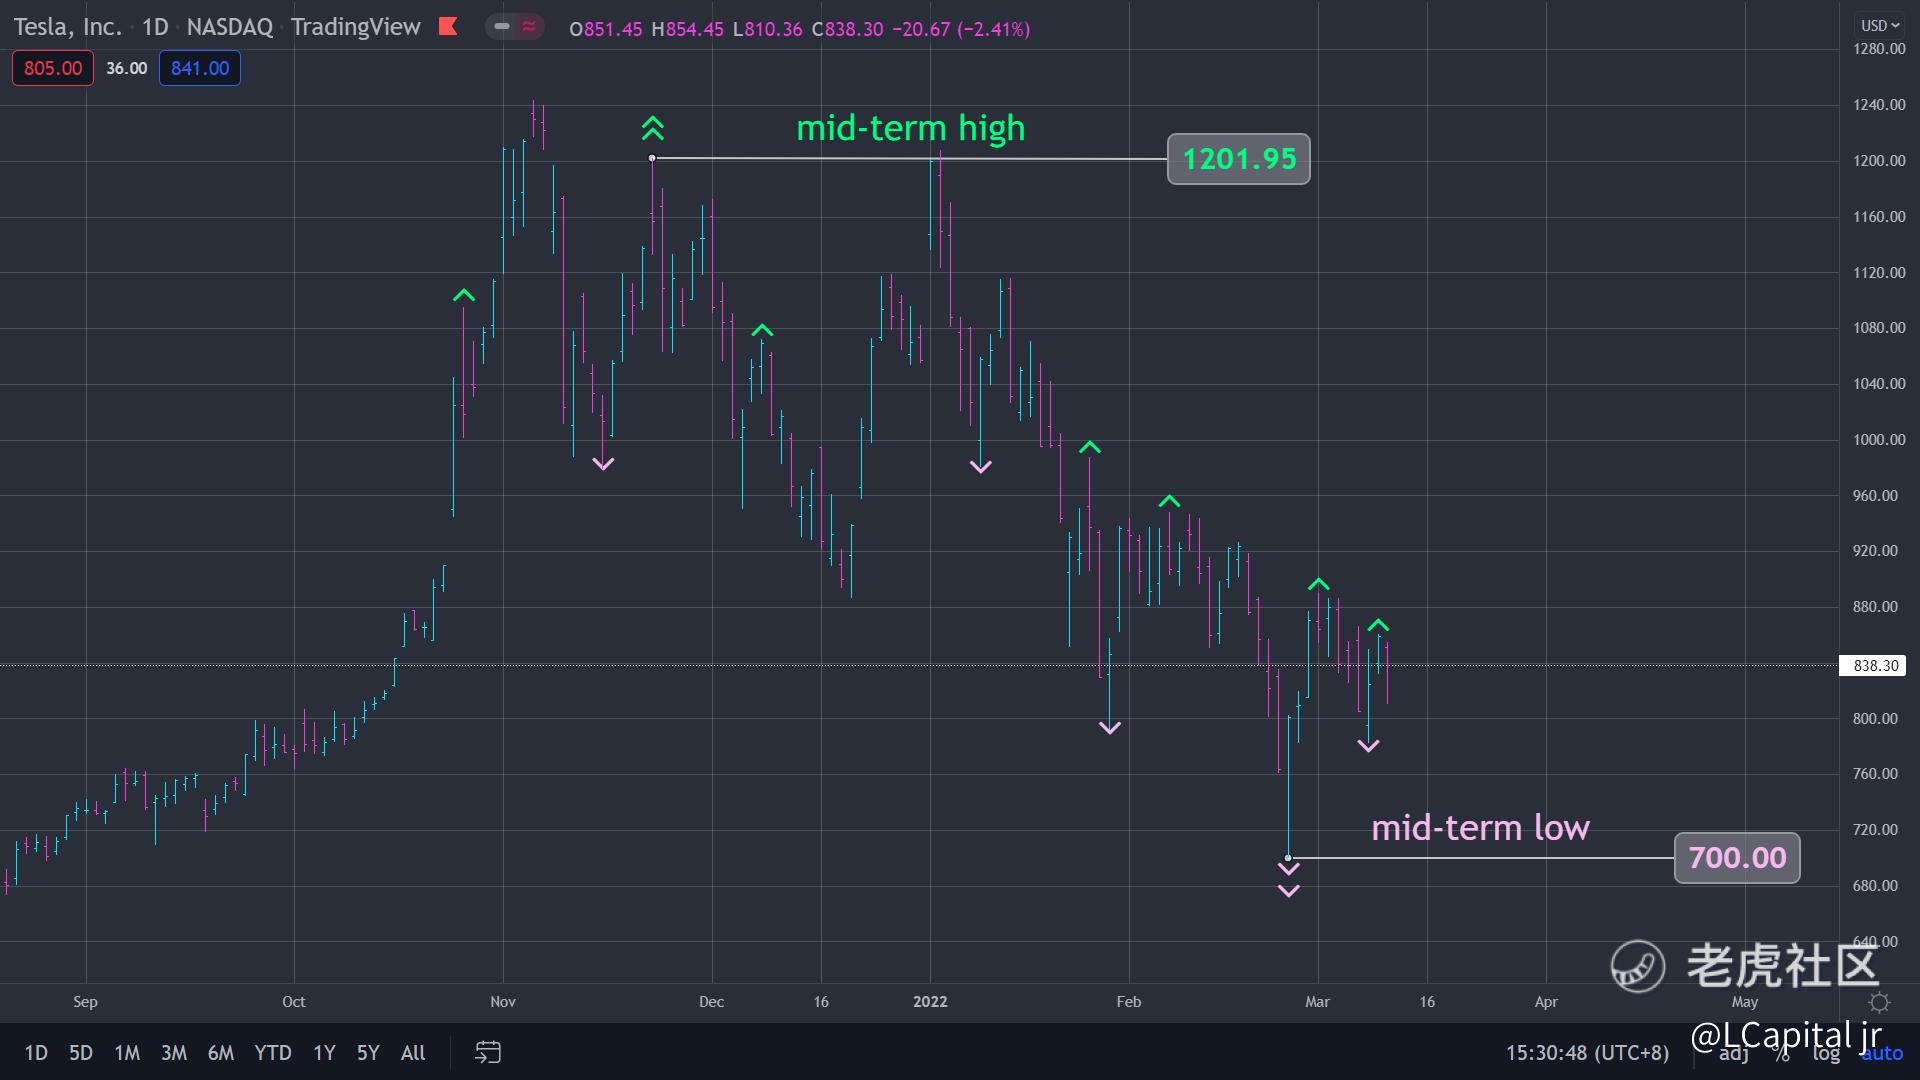
If you use the following simple formula to define short-term market lows. If you can learn this basic concept, you can gradually understand the entire market structure.

Whenever a daily low is flanked by a higher low, that low is a short-term low. Market movement has taught us that if price action on the day of the low was down, and then climbed again because there was no new low, then that low was recorded as a short-term low.

Short-term market highs are the exact opposite. Here we see lower highs flanked by highs, so that's because prices make their highest intraday highs and then start to pull back, thus making short-term highs.

If you understand the concept, we can put these elements together. You may have figured out the answer: the market swings from short-term highs to short-term lows.

If we can find short-term highs with lower highs on both sides (except the bullish and bearish engulfing), we can define a mid-term high as a short-term high with lower short-term highs on both sides. To go further, a mid-term high with lower mid-term highs on both sides is a long-term high.

I use these to trade. these useful price points are the most effective support and resistance I know yet. and once these prices are break, they will reveal a very important information about the market movement. Therefore, I can use them as a stop loss or trigger.
Technical Analysis
Here is the place for you to discuss & learn about technical analysis.
Disclaimer: Investing carries risk. This is not financial advice. The above content should not be regarded as an offer, recommendation, or solicitation on acquiring or disposing of any financial products, any associated discussions, comments, or posts by author or other users should not be considered as such either. It is solely for general information purpose only, which does not consider your own investment objectives, financial situations or needs. TTM assumes no responsibility or warranty for the accuracy and completeness of the information, investors should do their own research and may seek professional advice before investing.

Comments

  • Hosaid
    2022-03-14
    Hosaid
    But is there a chart indicate it thr stock is going down or up precisely? Yours is the chart you use on tiger trade? Pardon for my ignorance?
    • Hosaid
      Ok thanks.
    • LCapitaljr
      i using trading view to read chart bcoz it got lot of indicate i need. 
  • Remotecam
    2022-03-14
    Remotecam
    Thanks for this reminder.  Short term market price is driven by news, emotions (panic sell), manipulation and large force selling (margin calls). Knowing the stock's Intrinsic value keeps us sane.
    • JaiBo
      thanks guys. if you only check in the market once in a while, it best to avoid trading and go for blue chips. if want to trade, should be based on a rational strategy and not emotion trading.
  • DonnaMay
    2022-03-13
    DonnaMay
    We need a combination of approaches to make the right investment.
  • HilaryWilde
    2022-03-13
    HilaryWilde
    Volume can also be used to determine highs and lows.
    • LCapitaljr
      indeed. must combine with volume to prove the trend.  
  • MortimerDodd
    2022-03-13
    MortimerDodd
    The most important thing is to own great companies so you always have a chance to make a profit.
  • GregoryRichardson
    2022-03-11
    GregoryRichardson
    This is a great post,. When u master the basical formula and concept, it's more easy to make profit.
Leave a comment
2