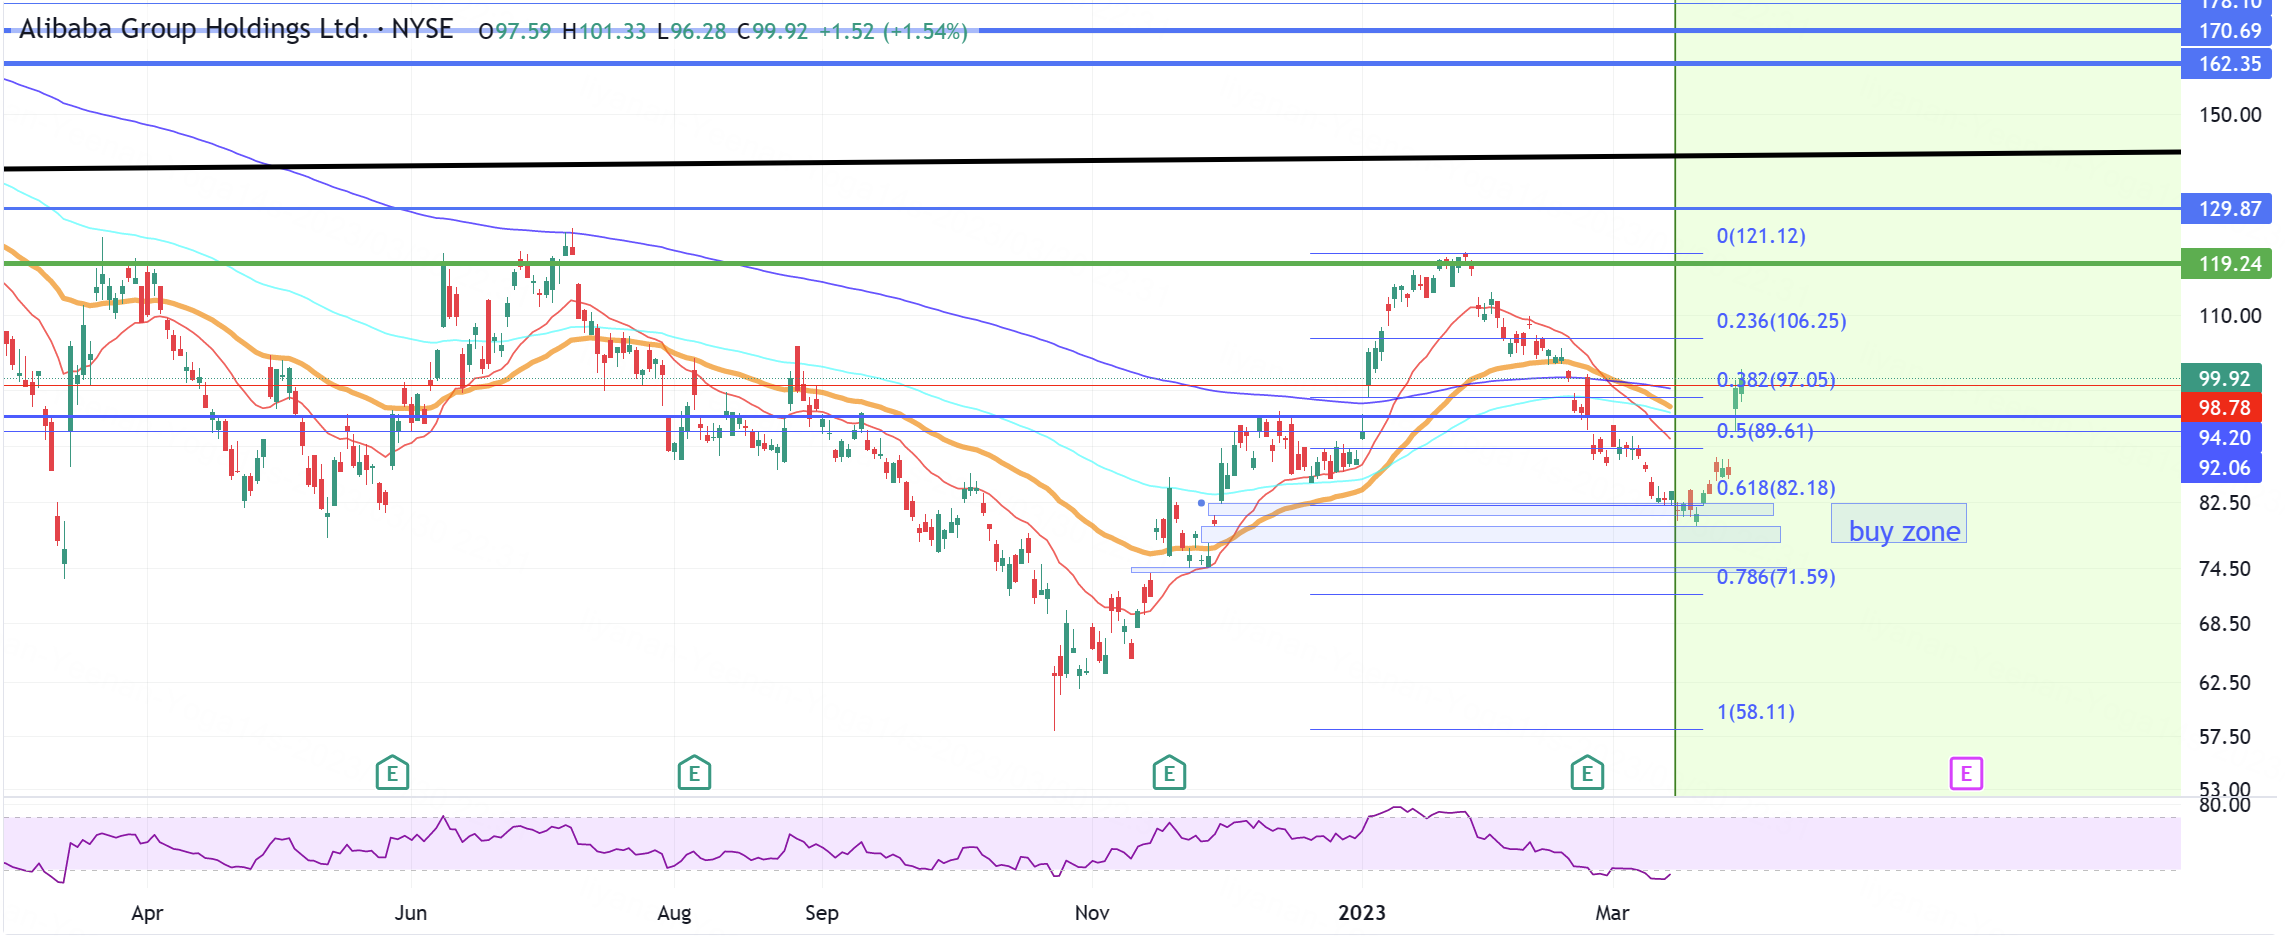
This is Alibaba daily chart. $Alibaba(BABA)$
Price on March 15 just below 0.618 Fibonacci retracement level from October low to January high.
Possible inverted head and shoulders to consider as well.
RSI in the lows.
There are a few gaps that could be filled. so I see 77-82 as a potential buying zone for a long term investment into this Chinese beaten down stock OR a good bounce zone for a short/mid term trade.
Trade safe!
82 was a buy.
The $17 move higher is just the beginning.
Disclaimer: Investing carries risk. This is not financial advice. The above content should not be regarded as an offer, recommendation, or solicitation on acquiring or disposing of any financial products, any associated discussions, comments, or posts by author or other users should not be considered as such either. It is solely for general information purpose only, which does not consider your own investment objectives, financial situations or needs. TTM assumes no responsibility or warranty for the accuracy and completeness of the information, investors should do their own research and may seek professional advice before investing.
Comments