Yet It Still Happened This Week!
“Markets Stop Panicking When Central Banks Start Panicking.”
In what could be termed as one of the most tumultuous weeks for the markets since the “black swan” event that caused a flash crash of epic proportions three years ago, the collapse of SVB initiated a sequence of events which led to historical moves in the sovereign bond markets.
Though equity markets remain unnerved and the selling pressure was concentrated among the banking names, the bond markets witnessed excruciating pain. Bond markets underwent a massive panic attack as liquidity dried up and volatility surpassed unprecedented 2008 GFC levels.
It was chaos on trading desks as traders who started their careers post the GFC had never encountered such violent moves and deteriorating liquidity conditions.
In Europe, as rumours spread over the health of Switzerland’s second-largest bank: Credit Suisse, panic and fear gripped the markets. Switzerland National Bank (SNB) had to issue a statement to soothe the nerves and also provide a $54 billion liquidity line to thwart the fallout of CS.
As always, the answer to all the problems by the Central Banks is solely “ money printing” and unlocking the liquidity floodgates. As per JP Morgan, the Federal Reserve will pump in a record $2 trillion of liquidity via its new “emergency” funding program Bank Term Funding Program (BTFP), to heal the bruised banking sector.
We also got the inflation number, PPI, retail sales in the US and the ECB rate decision among all the confusion and mess. Today, we will discuss the economic data, the freeze of bond markets, and where the banking woes lead us.
Economic Data!
The much-awaited CPI data was released in the US this Tuesday. The headline number came in at +6% YoY and +0.4% MoM, which was in line with the estimates.
Core inflation came in at +5.5% YoY and +0.5% MoM, slightly higher than expected at +0.4%.
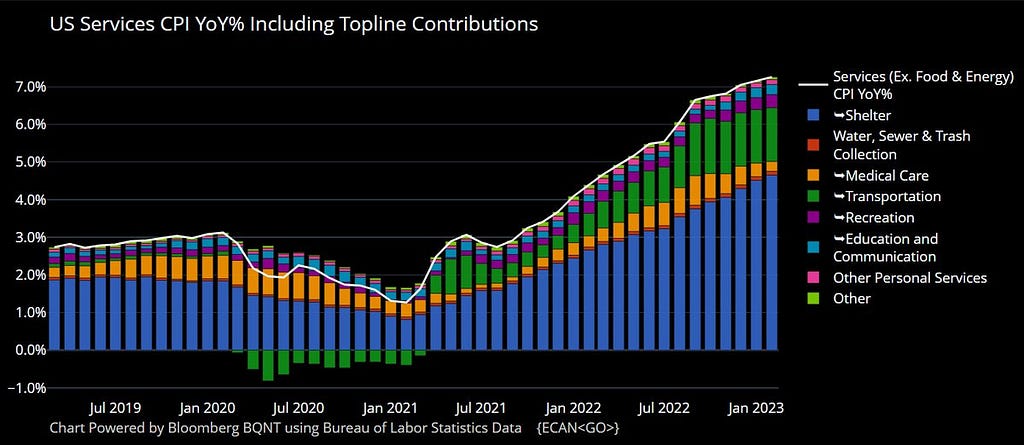
When we dig deep, shelter, the most lagging part of the inflation, now contributes around 70% to the overall CPI increase. Thus, as the shelter prices fall from April, we might see a considerable decline in the headline number.
I have constantly been writing for the last two months that due to the lagging shelter effect, slowing growth and the base effect, inflation is expected to fall to around 4–4.5% by the end of June.
Nevertheless, H2 will be tricky as the base effect will wane off. Furthermore, we need a material rise in the unemployment rate if inflation is to be brought down to 2% as wages still run high (more than 4% as measured by Average Hourly Earnings-AHE).
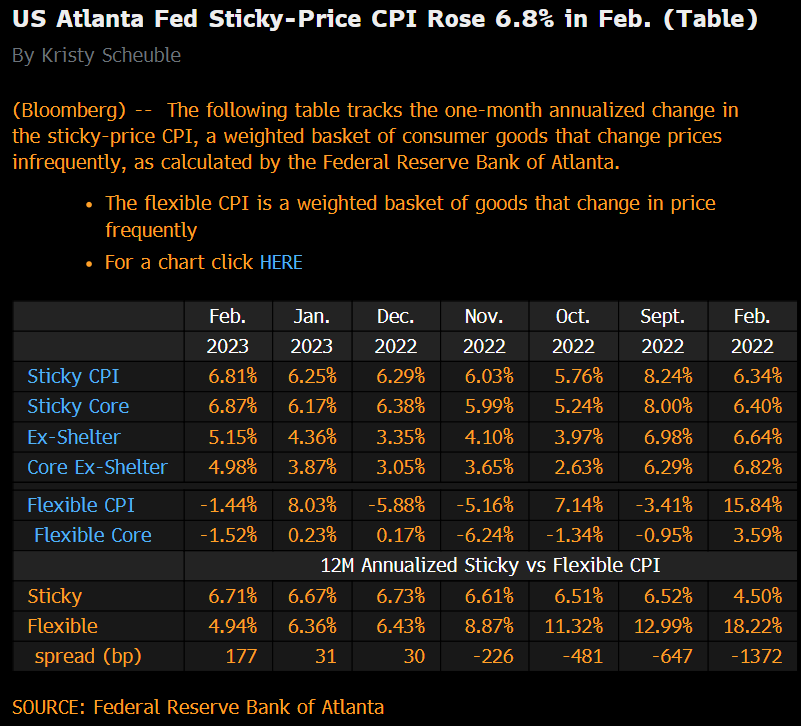
As a result, one needs to track the sticky component of inflation as calculated by Atlanta Fed.
The Fed can’t lose the inflation battle if it has to regain its lost credibility after the “transitory” inflation failure and the SVB collapse. The triumph against inflation can only be achieved if it doesn’t lower the guard and cut prematurely in the rate cycle.
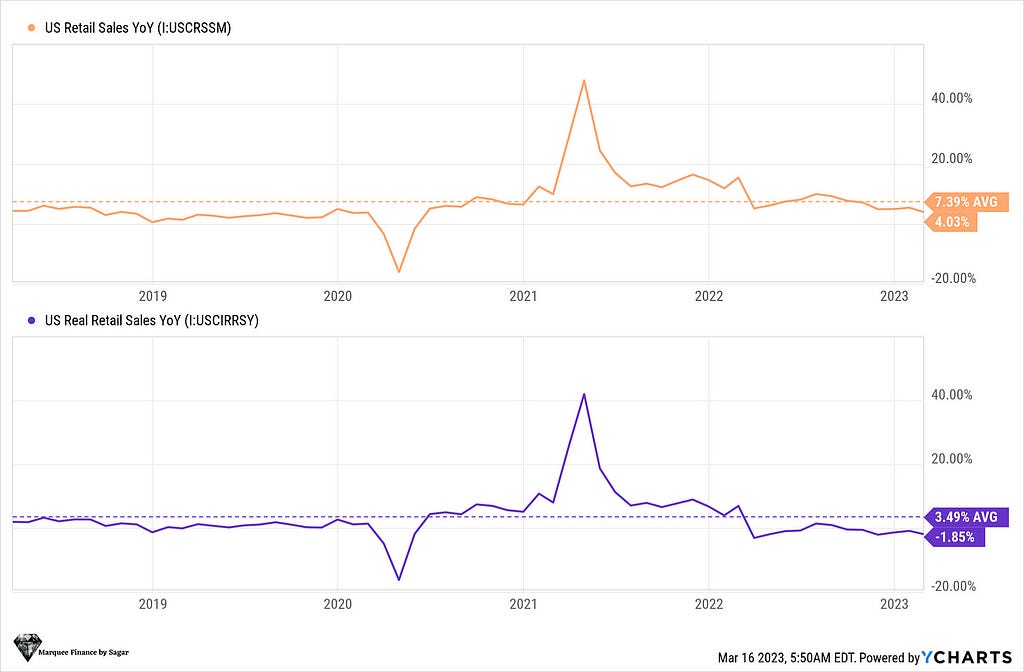
The next set of important economic data was retail sales. While the nominal retail sales were positive and in line with estimates, the trend in real retail sales (adjusted for inflation) remains negative for more than 12 consecutive months now.
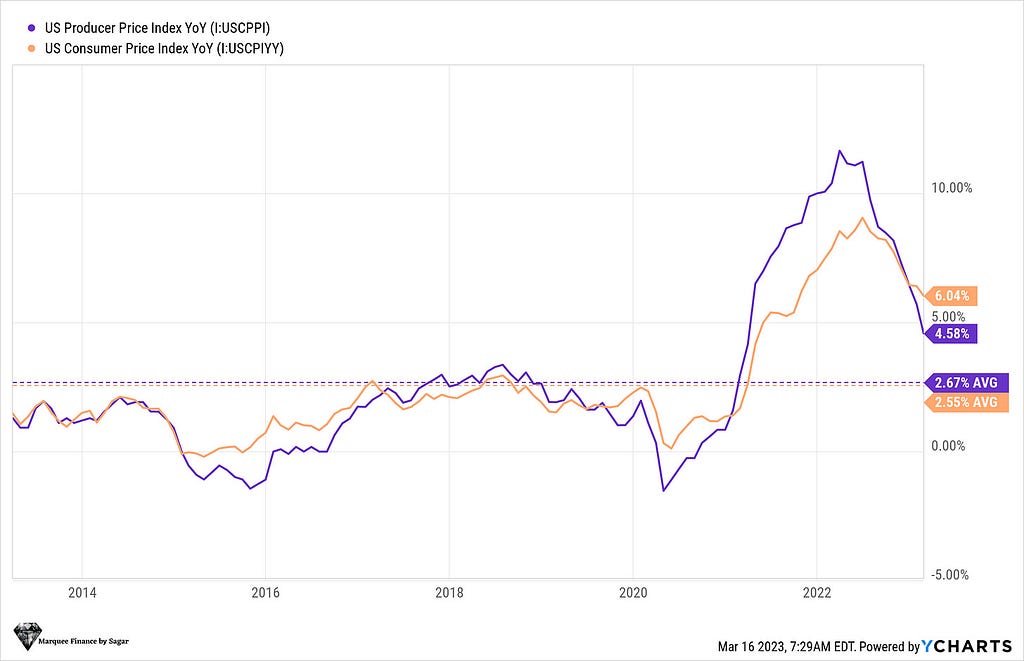
The Producer Price Inflation (PPI) was the biggest surprise as it came below consensus and indicates that the overall price pressures are softening for manufacturers.
This also affirms that CPI may fall going forward, following the PPI.
Bond Markets Panic And The Future!
“Credit is the air that financial markets breathe, and when the air is poisoned, there’s no place to hide”-Charles R. Morris.
Chaos erupted in the sovereign bond markets post the SVB collapse. As trust in the regional banks vaporised, even the interbank lending froze, akin to the covid crash and the 2008 GFC.
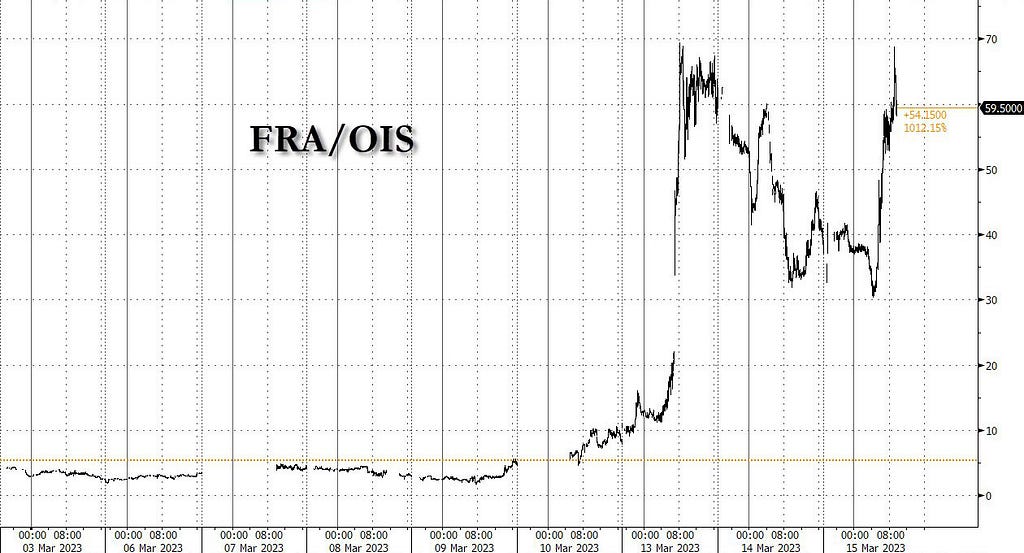
FRA-OIS spread, a gauge used by market participants to measure the stress/liquidity conditions in the interbank markets, saw unprecedented moves and surpassed the covid levels.
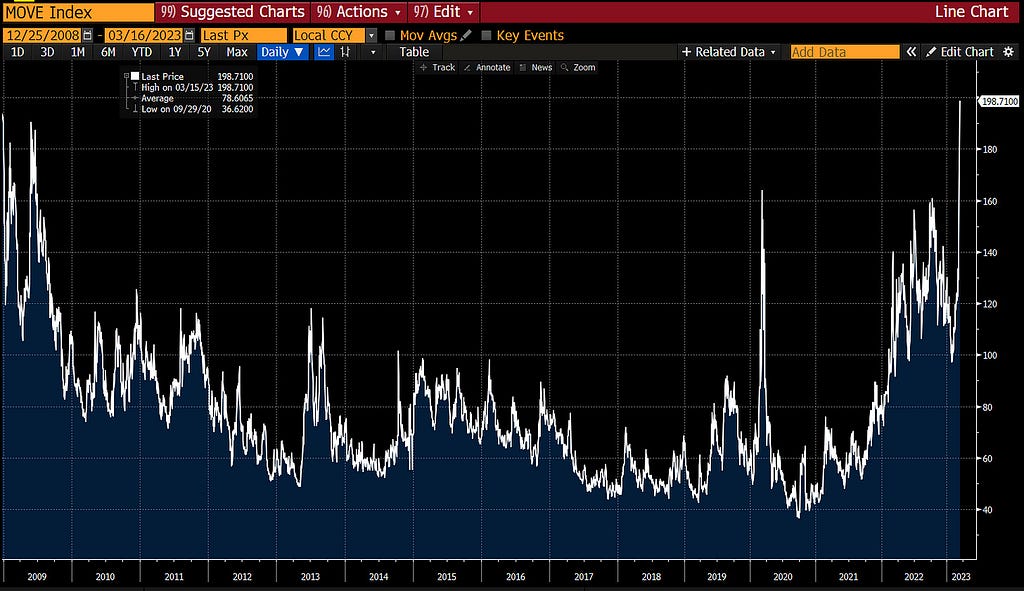
The real crisis transpired in the liquidity-parched sovereign bond markets, where the volatility reached the 2008 GFC levels (as measured by MOVE Index)
Even the Fed Funds Futures (FFR) saw an enormous dip in liquidity, and in a rare episode, the SOFR futures were halted due to a “technical” glitch.
The markets witnessed a 12SD move in the 2Y bond, as in just five trading sessions; the 2Y moved from more than 5% to less than 4%. You will be astounded to know that the probability of such a move is 1.77E-33 or never in the universe’s history.
Nonetheless, the bond markets had one of the highest “net” short positions, and thus positioning can explain some of the violent moves. Some market participants also suspect that the drastic fall in yields has resulted in enormous losses for some hedge funds (names will be out shortly).
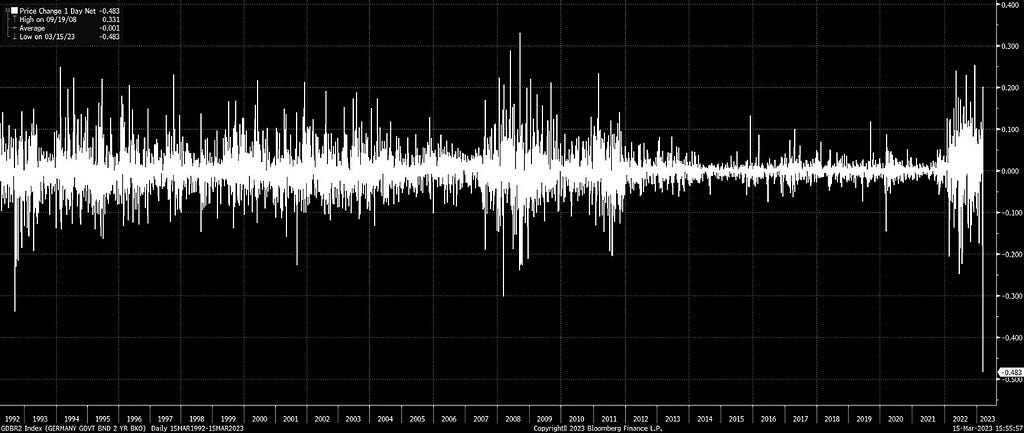
The Credit Suisse saga further elevated the turmoil in the European bond markets as the German 2Y witnessed the highest volatility since the 1980s.
As expected, the ECB hiked by 50 bps, and future rate hikes look uncertain. If the bond markets are to be believed, then this was the last hike by the ECB, and the next week’s 25 bps hike by the Fed would be the last.
But the biggest question arises: What Next?
Now, there are two parts to the current paradigm.
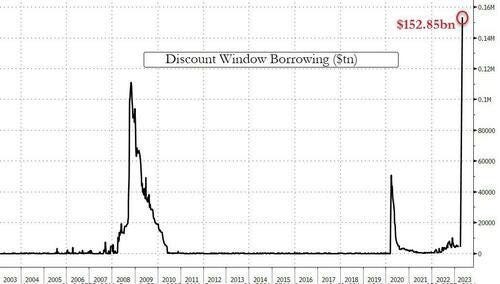
- Liquidity: As the markets went haywire due to uber-tight liquidity, the lender of the last resort pumped in more than $152 billion via the discount window, $12 billion via BTFP and $142 billion via “other credit extensions”. This was deemed necessary to prevent a fallout of the banking system due to the SVB collapse.
Regional banks are facing a triple whammy of deposit outflows, contracting NIMs (Net Interest Margins) and the likely rise in loan losses as they account for around 69% of the total Commercial Real Estate (CRE) lending.
Thus, we can safely conclude that if the problems persist with the regional banks, then the Fed would continue to pump in liquidity, which would, in fact, lead to loosening financial conditions.
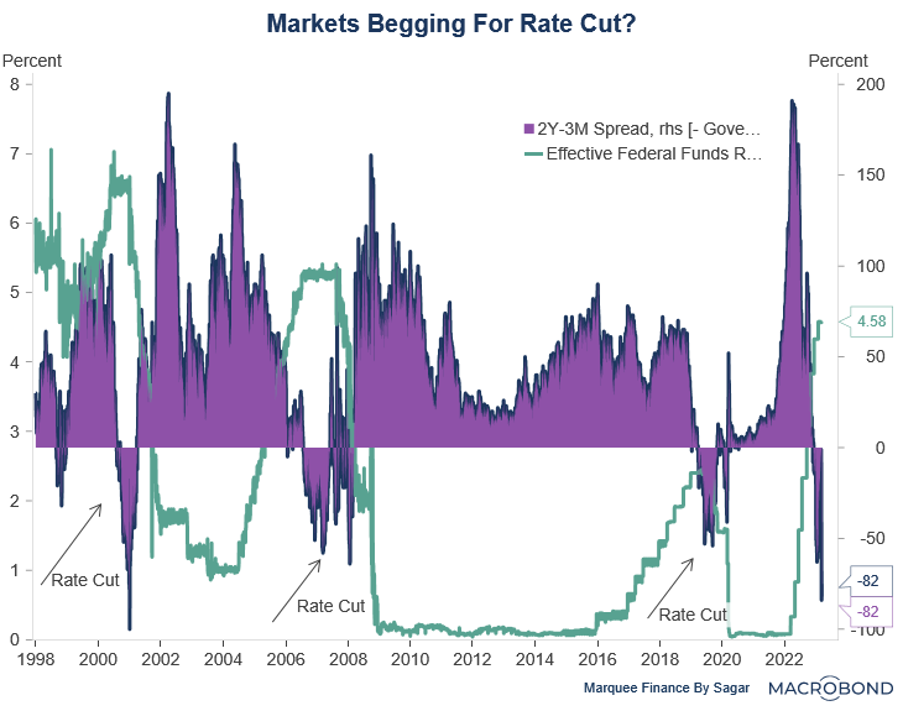
- Rates Trajectory: Fed would most likely halt next week after the 25 bps hike. However, the markets are pressuring the Fed for rate cuts. Whenever the 2Y-3M spread has turned this negative, the Fed cut rates in the next 3–6 months.
Fed is indeed stuck in a rock and a hard place. As financial stability concern mount, they have no option but to provide liquidity and to control inflation, they need to keep rates higher.
The current saga results from the difference between the deposit rates and the MMFs (Money Market Funds), which disincentivise bank deposits as funds move to MMFs, thus creating instability in the banking sector (especially smaller banks with low reserves).
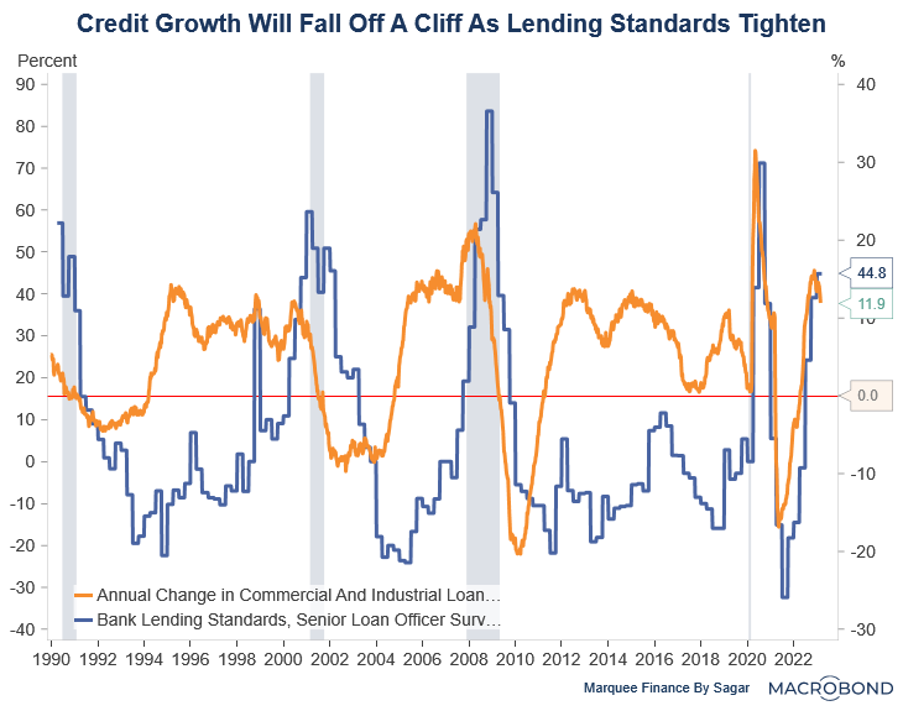
Nevertheless, the regional banks’ fallout implications will be tighter lending standards. Undoubtedly, as the lending standards tighten, the flow of credit to the economy will collapse, and we will see a material slowdown in growth.
This might get exacerbated as, according to Goldman Sachs, banks with less than $250bn in assets account for 50% of US commercial and industrial lending, 60% of residential real estate lending, 80% of commercial real estate lending, and 45% of consumer lending.
What Are The Investors Doing?
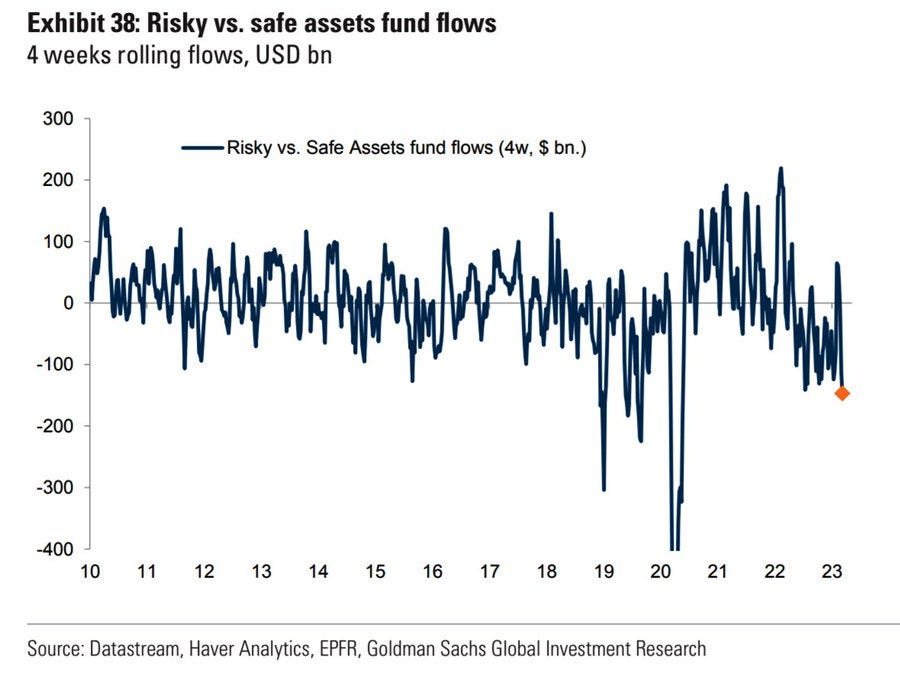
As panic and fear spread across the markets, risk-off sentiment took over, and investors dumped risk assets and poured billion into the safe assets.
However, as global liquidity rebounds, we might see some money returning to the risk assets.
In the last three months, we have repeatedly discussed that PBoC and BoJ are already adding enormous liquidity to the global financial system. As the Fed joins the party by increasing its balance sheet by a colossal $300 billion in just 72 hours, we might witness positive sentiment across the equity markets.
In fact, tech stocks witnessed a swift rebound as rate-cut bets increased, with the markets now predicting 100 bps of cuts before the end of the year. (Remember that lower rates lead to higher valuations for tech stocks).
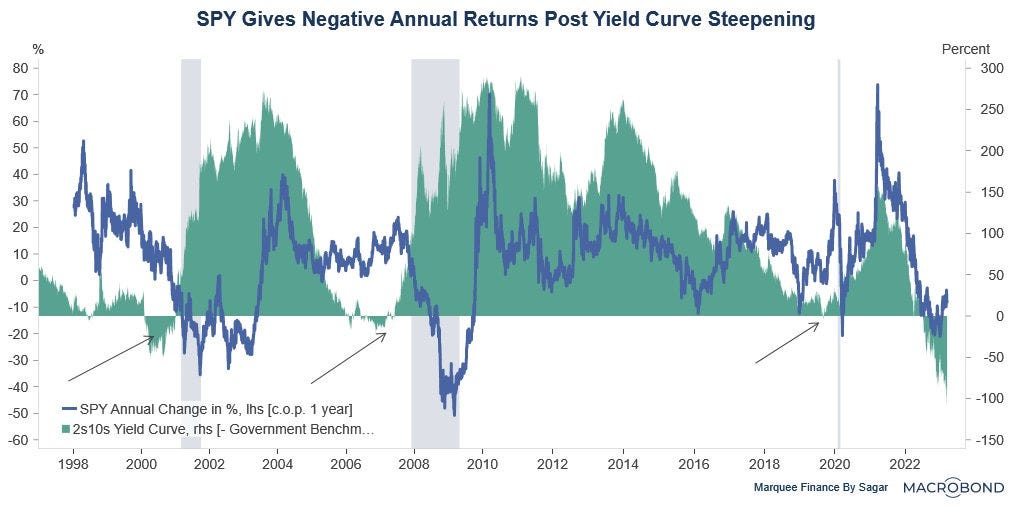
Nevertheless, the historical precedence indicates that as the curve steepens from a deep inversion, S&P logs a negative annual return post the steepening.
The curve initially steepened vigorously post the SVB fiasco but has stagnated as the 2s10s now stands at -60 bps. It’s expected that the curve might steepen in the 2–3 months, signalling:
- A Recession
- Potential rate cut
Conclusion!
We are most probably entering unchartered territories.
Last year, when the pension funds blew up in the UK, the BoE pumped in liquidity while raising rates.
Similarly, following its British counterparts, Fed has chalked a similar trajectory and infused liquidity while it’s set to raise rates next week, albeit by 25 bps.
The Central Banks seem to have found solace in the QE + Higher rates policy.
However, the ramifications of such a policy can be catastrophic, especially when they are fighting the monstrous inflation battle and their credibility is at stake.
Loosening financial conditions and the liquidity injection might reignite inflation, which seems downward and is headed for a 4–4.5% headline number by the end of H1.
The biggest policy blunder would be prematurely cutting rates while inflation remains above the 2% target.
The risk assets might rally as they love liquidity more than ever, but as the economy heads into a recession, will the earnings help?
Most probably not!
The current circumstances and the SVB fallout have increased the odds of a hard landing which had a low probability earlier (I discussed in detail the probabilities here).
You can’t miss the next week’s FOMC meeting at any cost.
It Was Not Supposed To Happen In 50 Million Years! was originally published in DataDrivenInvestor on Medium, where people are continuing the conversation by highlighting and responding to this story.
Comments