$XPeng Inc.(XPEV)$ designs, develops, manufactures, and markets smart electric vehicles. It produces environmental friendly vehicles, namely SUVs (the G3), and a four-door sports sedan (the P7). The company was founded by Xiao Peng He, Heng Xia, and Tao He in 2015 and is headquartered in Guangzhou, China. It put in a strong rally since it got listed on NYSE back in 2020 and reached a high of $74.49 back in November 2022. This was followed by a sharp decline to $37.50 in December 2022, then it bounced and started drifting lower. In today's article, we will take a look at Elliott wave structure of the decline since November 2022 peak and determine whether selling pressure is likely to continue for a prolonger period or it would end soon resulting in buyers entering the market.
ZigZag Elliott Wave Structure
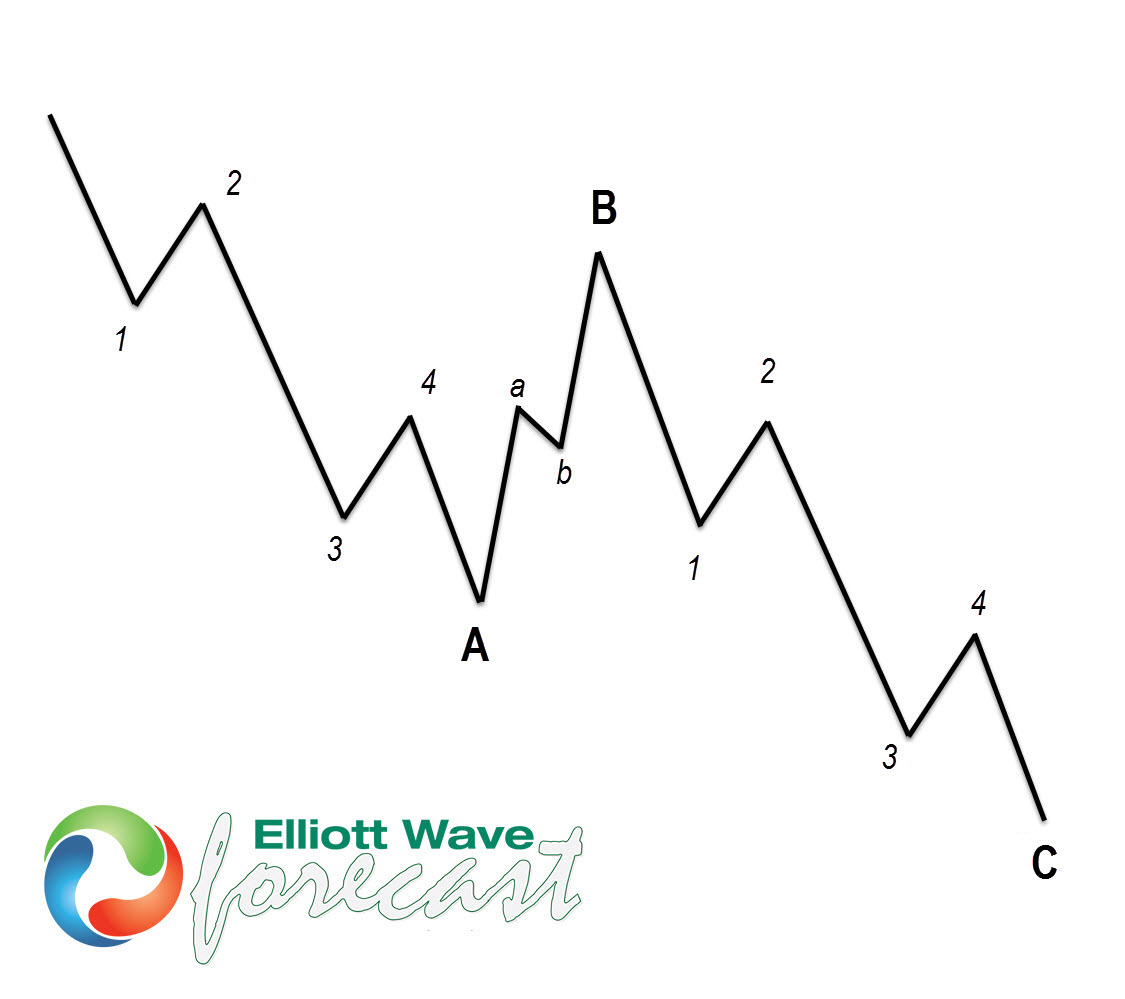
Zigzag Elliott Wave Structure is a 5-3-5 structure in which both wave A and C are in 5 waves and wave B is in 3 waves. Wave B can take the form of any corrective structure including FLAT, double three, triangle etc. Below is a graphic representation of what a Zigzag structure looks like.
 XPEV Elliott Wave Analysis
XPend Inc (XPEV) decline from November 2022, as shown below, is taking the form of a Zigzag Elliott wave structure. We can see first leg of the decline i.e. wave "a" is from $74.49 to $22.73. Within this decline, wave ((1)) ended at $37.50, wave ((2)) ended at $60.04, wave ((3)) ended at $25.27, wave ((4)) ended at $39.24 and wave ((5)) ended at $22.73. This was followed by a 3 waves bounce to $56.45 which completed wave "b". Internal structure of wave "b" was another zigzag structure. Then the decline resumed and we have already seen a new low below $22.73 confirming wave "c" lower is in progress. Within wave "c", wave ((1)) completed at $18.01, wave ((2)) completed at $35.35 and wave ((3)) completed at $6.25. This was followed by a bounce to $13.10 and stocks has started turning lower again. It has not yet made a new low below $6.25 but we are calling wave ((4)) completed at $13.10. While below this level, expect wave ((5)) of "c" to continue lower toward $4.48 or slightly lower. In case of a break above $13.10, we should still be in wave ((4)) as a double correction with one more leg lower still to come to complete the structure. We expect correction to end at $4.48 or lower and expect buyers to appear in this area and resume the rally or produce a larger 3 waves bounce at least.
source:barchart
Comments