What A Week It Has Been!
As the dark clouds of the banking mess that rattled the markets swayed away, the markets focus shifted back to the macro data and the updates in energy markets this week. Most of the economic data shocked the street.
I have repeatedly reiterated that the monetary transmission acts with a 2–3 quarter lag, and the leading indicators were all flashing red. The red flags are now emerging in the lagging data of labor market as well.
We are gradually reaching a point where the data worsens, inflation moves down to 4% (due to base effects and growth plunge), and the bond markets forces Fed to cut rates.
One should not be surprised that the bond markets are now envisioning cuts of 75 bps before the end of 2023. Nonetheless, equity and credit markets remain complacent.
If the Fed indeed heeds what the market anticipates (cuts), we may be on a roller coaster ride for H2, where inflation likely resurges, and the pricing across asset classes becomes very volatile.
All in all, there is no room for error.
Let’s decode this week’s market developments and the reasons behind the current resilience of the equity market.
Cracks In Economic Data!
This week was very heavy in economic data; ironically, it was all over the place.
There were a ton of misses, which can also be partially attributed to the negative sentiment post the SVB fiasco.
First, we will discuss the ISM data across manufacturing and services.
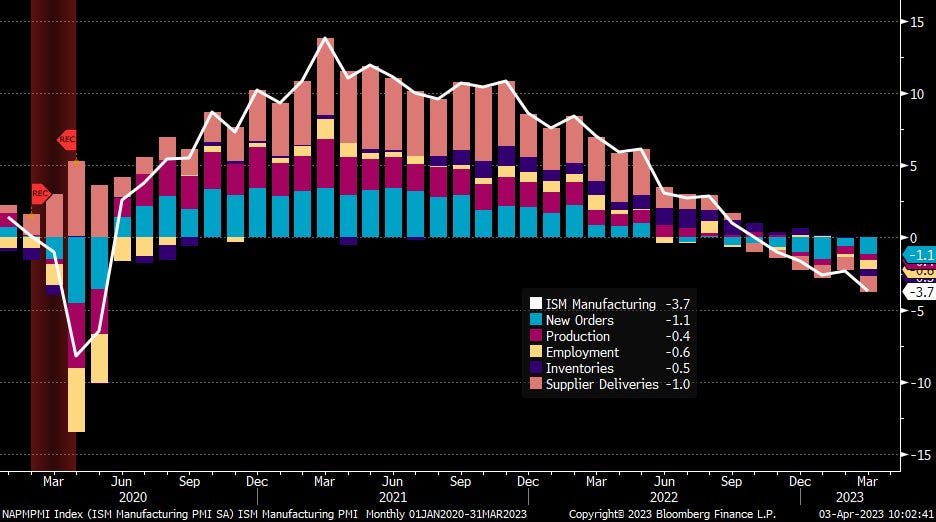
ISM Manufacturing PMI is one of the most tracked leading indicators, which corresponds to the business cycle and perfectly explains the cyclical components of the economy.
The ISM came in lower than expectations and is “still falling”.
The supplier deliveries are at the lowest level since the GFC, and even prices paid witnessed some softening (though more data is required to confirm the trend). Furthermore, orders less inventories are still at levels which is recessionary.
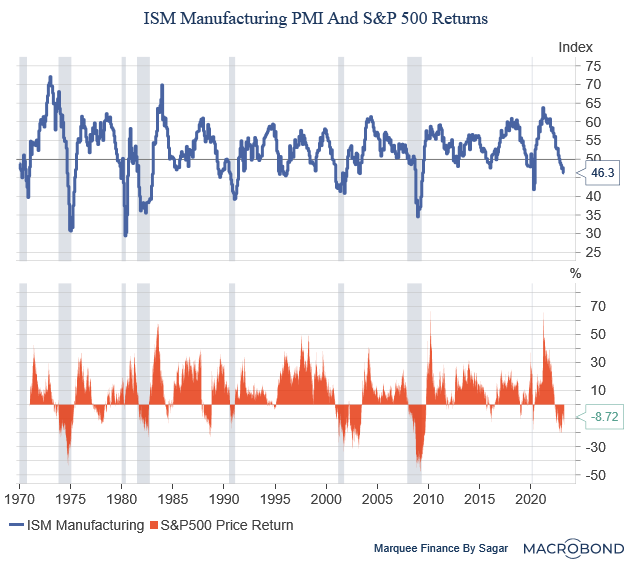
The ISM is super important for equity markets as the historical data indicates that equity markets returns are closely correlated with ISM Data. Whenever the ISM Manufacturing PMI is falling below 50 (and continues to do so), stocks always give a negative return.
We can observe that the markets give a positive return when ISM claws back to the above 50 after bottoming out.
Note that these are annual returns (YoY).
So, if you believe that ISM will bottom out later this year, then 2023 will be a year of negative returns; and 2024 will yield healthy returns (If ISM moves back above 50 and continues to do so).
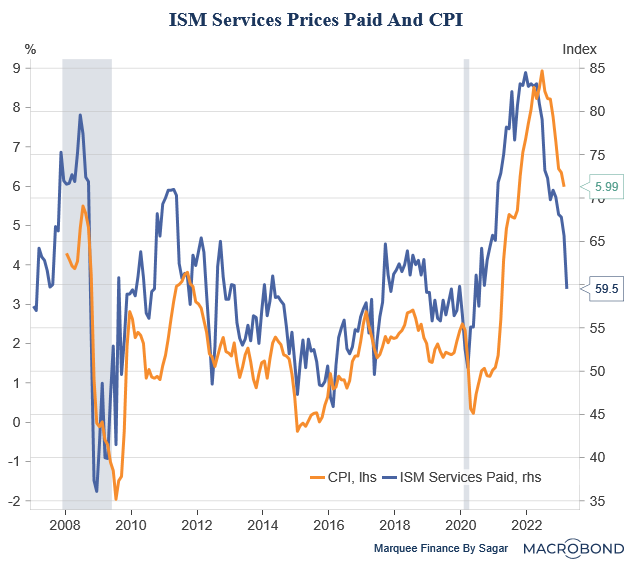
Next was the ISM Services PMI, and it was also soft. The astounding data point here was the ISM Services Prices Paid, which was, IMO, the chart of the week.
The services sector was the most resilient pillar of the economy. However, cracks are clearly emerging here, and the lower prices indicate that the growth plunge is leading to lower inflation (As I mentioned late last year).
The CPI, as I have been writing, is expected to touch 4% by June, which the ISM Services Prices Paid also corresponds to.
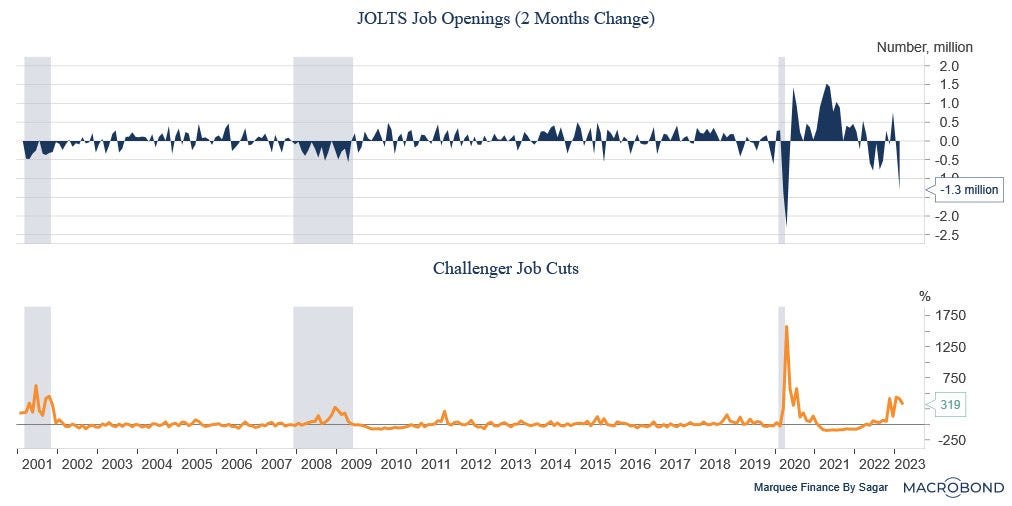
The other data point that stunned on the lower side was the JOLTS Data. The current month’s reading came below expectations, and the revisions wereshockingly on the lower side. Digest this:
While the 2-month drop (1.3MM) in job openings was the 2nd highest on record, only behind the covid economic collapse, Challenger Job Layoffs continue to surge and rose by 319% YoY.
Nonetheless, the Unemployed/ Vacancies ratio at 1.67, though well off the peak from 2.0, remains elevated compared to 1.20 pre-covid-levels.
Unemployment is the most lagging indicator, as we all know, but it’s what the Fed is looking at currently.
The only positive surprise was the Non-Farm Payroll (NFP) data which came in slightly above the forecast at 236k, which led to the unemployment rate falling to 3.5%, near record lows.
When we dig deep, we see that cyclical sectors of society, such as manufacturing and housing, continue to shed jobs (66k in the last five months).
You will be surprised to know that 77% of the monthly gain (177k out of 236k) was the government, education & health service, and leisure, indicating private sector ex-services are languishing.
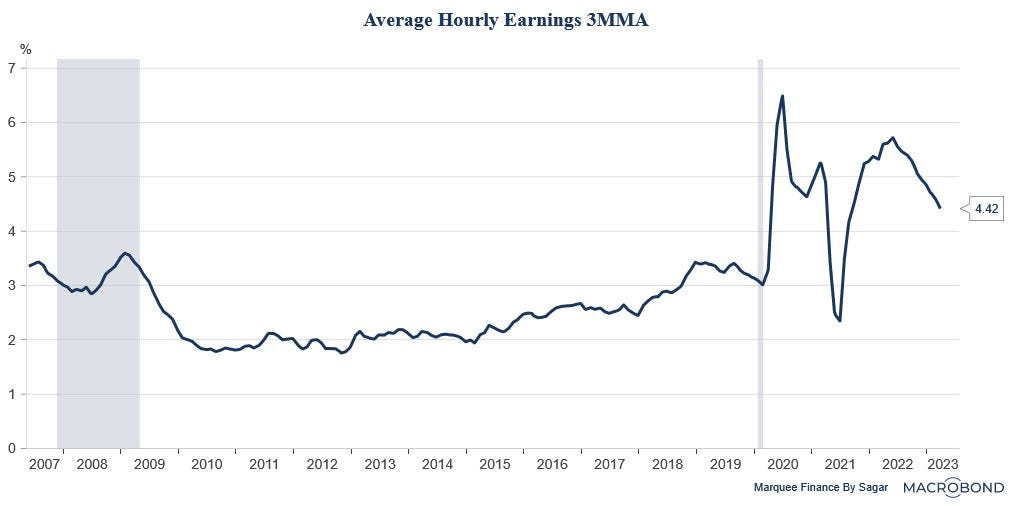
Furthermore, Average Hourly Earnings (AHE) (3 Month Moving Average) is now down to 4.42%. Note that the pre-covid number was 3.3%.
This number is super important as the softening of wages is crucial if inflation is to be brought down to 2%.
Nevertheless, the road from 4% to 2% will be rough, and if the bond markets are to be believed, the Fed will cut rates by at least 75 bps before the end of the year.(No Room For Error)
A premature loosening will lead to a resurgence of inflation as the global liquidity remains strong, and China will probably start exporting inflation in H2.
Furthermore, the upheaval in energy markets can’t be ignored.
The OPEC Surprise!
The highlight of the last week in the commodity markets was the shakeout in the energy markets.
In an ambush that shocked even the White House, OPEC+ decided to “voluntarily” reduce the output by 1.16 mb/d; this is on top of the Russian voluntary cut of 500k b/d announced two months back.
As a result, OPEC+ has effectively cut the total global oil supply by roughly 1.5% for the rest of the year.
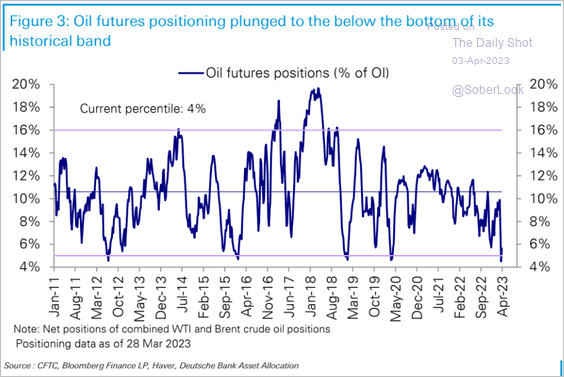
The cuts led to a massive short covering as the paper markets were extremely short due to the worsening demand outlook post the SVB fiasco.
The physical markets were already showing signs of a glut, and thus, many Hedge Funds took enormous short bets on the market.
Nevertheless, once the dust settles and the market normalizes after the short squeeze, the focus will return to the oil market dynamics.
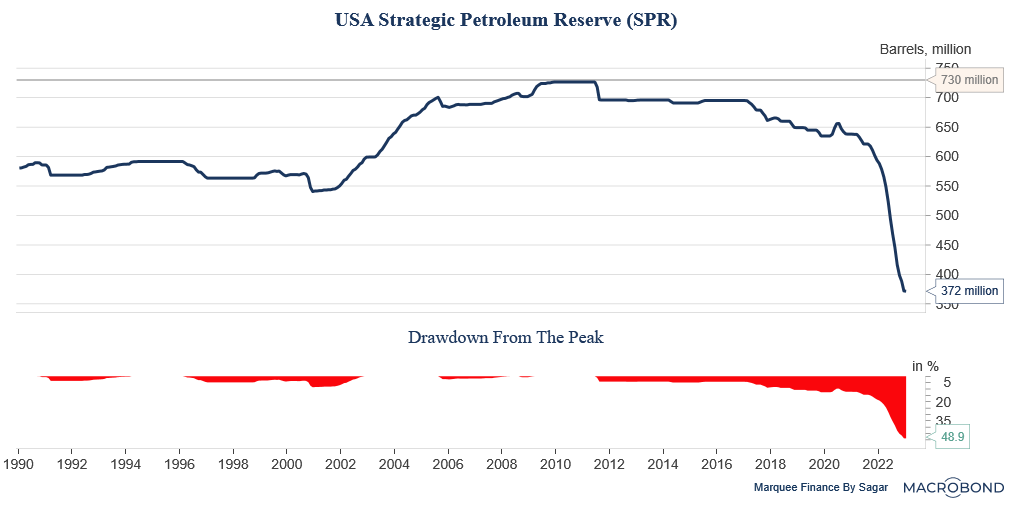
Last year, I wrote that the White House was committing a historic blunder by draining out the Strategic Petroleum Reserve (SPR).
OPEC+ can anytime cut the supplies, while the US had limited options, and unfortunately, the Biden administration panicked and decided to drain the SPR.
In fact, the costliest mistake was “not” to refill the SPR when prices breached the $70/b mark last month.
The decision to refill could have given the necessary leverage for the future and would cushion the impact of future OPEC+ cuts.
When discussing the supply-demand scenario, the key to the oil price movement remains the Chinese oil demand in H2 this year.
It is well expected that as the economy slows, the demand from the West might plunge, but it was anticipated that the demand from China would outweigh the fall from the West.
Nonetheless, the above scenario has failed to materialise until the end of Q1.
The Chinese mobility data indicates that though the total air volume has recovered, it’s primarily led by domestic flights, while outbound tourism remains a non-starter.
The passenger traffic also remains subdued and way below the pre-pandemic levels.
Nonetheless, it’s still an early trend, and we will have to wait another 1–2 quarters to see how the reopening pans out. If the passenger traffic reaches the pre-pandemic levels, the oil demand will zoom, keeping prices buoyant.
Though $100/b is still a pipe dream, as many are predicting.
The Markets Overview!
Ironically, the current market rally has surprised most of the market participants considering the banking woes and weak macro data.
A confluence of factors at play can explain the rally.
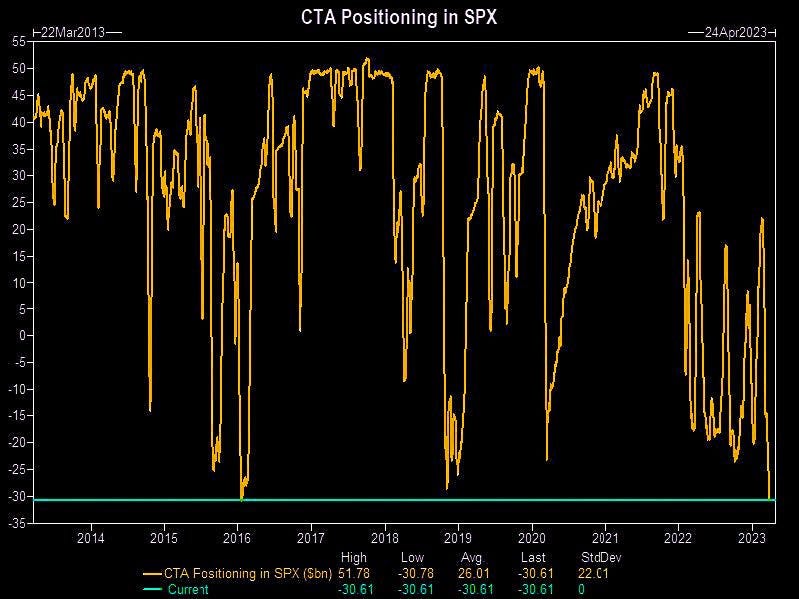
Firstly, the most significant factor driving stocks up is the positioning which seems to be on the short side. The sentiment became extremely bearish post the banking fiasco and Credit Suisse (CS) fallout, which acts as a contrarian indicator for equities.
The CTA positioning in SPX has been the most bearish in the last 10 years, just before the current rally commenced (as of 27th March)
Source: Twitter
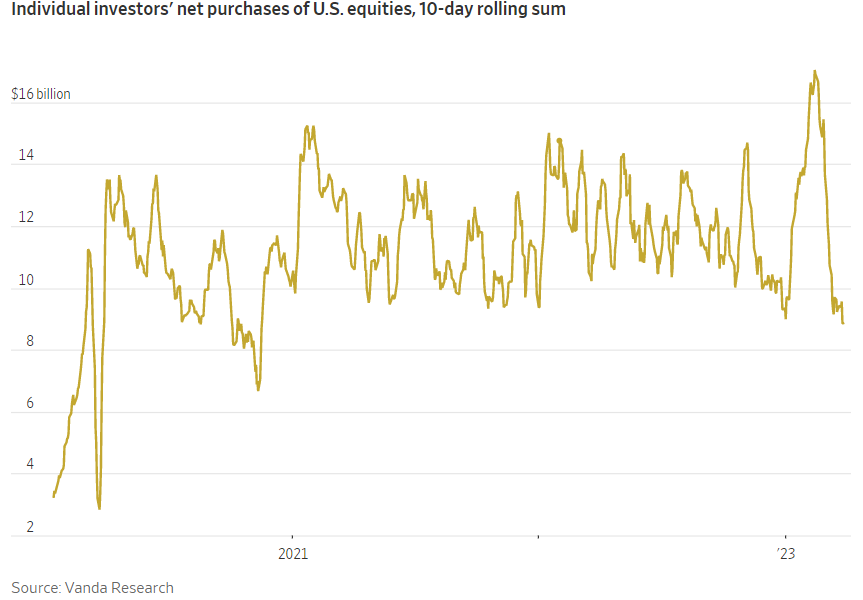
Secondly, retailers are still buyers; however, the intensity of buying has reduced as the consumers run out of their excess savings and the higher rates percolate into the economy (the interest cost for HHs increase as % of disposable incomes).
Remember I wrote about two weeks back that, as per GS, US consumers would have to sell stocks worth $750 billion as they exhaust their excess savings by the end of H1 (most likely).
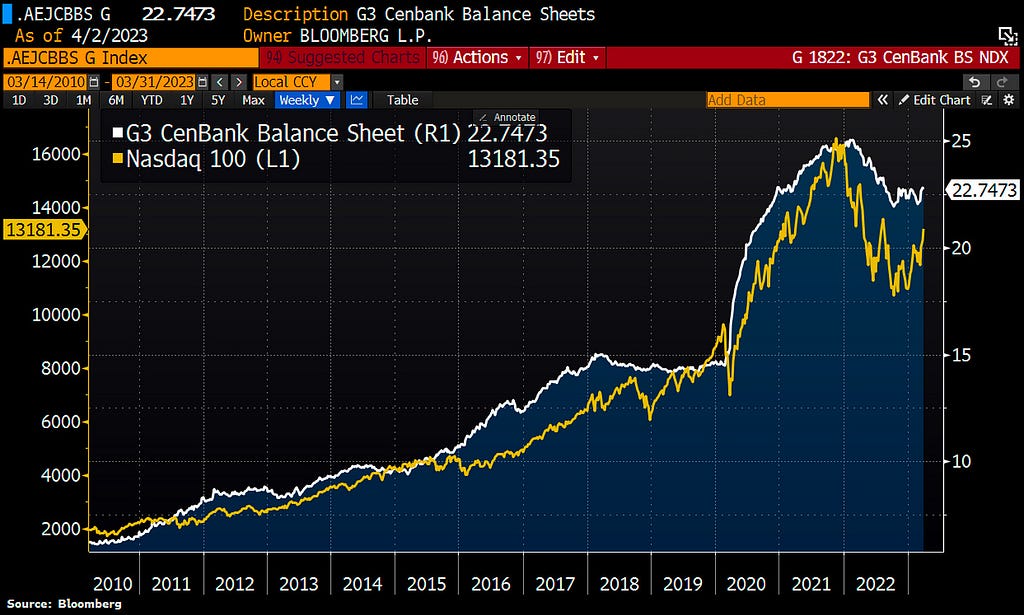
Thirdly, the global liquidity is strong as PBoC and BoJ continue to pump enormous money, and the Fed joined the party. You will be astounded to know that BoJ pumped in a record $1 trillion last year and will most probably do the same or even more this year (if YCC is not abandoned)
Ironically, the markets move in tandem with liquidity, it seems.
The chart portrays the Balance Sheet of the Fed, ECB and BoJ. The trump card remains with the BoJ as the other two CB’s balance sheets might move sideways.
Lastly, the market breadth is becoming narrower with each passing day. You will be astounded to know that only 8–10 mega-cap stocks are responsible for most gains.
As a result, the zombie companies (Interest coverage ratio <1 and a market cap > $300 million) are now underperforming the S&P 500 by a record 20%.
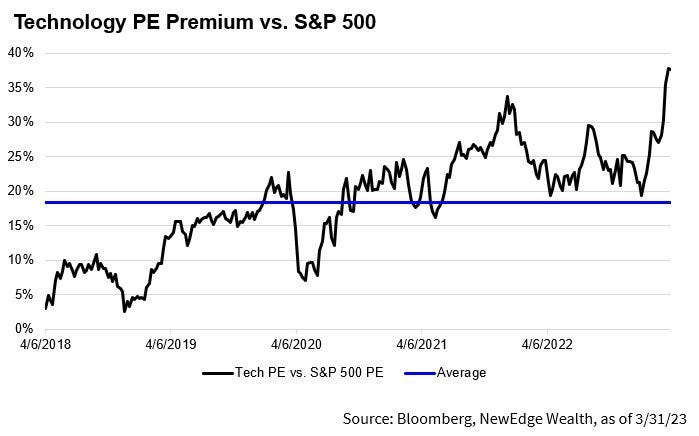
In fact, what is mind-boggling is that tech stocks now command a premium of a whopping 38% to the S&P 500.
This is now higher than the times when the Fed’s printer was in full force, and rates were nearly zero post the pandemic in 2021.
It’s baffling to note that the NASDAQ is on the verge of a bull market and is now up 20% from its lows in October.
The short-term moves in stocks are always dictated by positioning and sentiment. Therefore, it’s no surprise that the markets rallied post the CS debacle.
However, one needs to be cautious as the data continues to worsen, and now is the time to stay away and not jump in.
Conclusion!
Weakening Macro Data: ISM Manufacturing and Services are falling, pricing pressures are easing, and labor market softening has begun.
Inflation Outlook: Inflation is likely to be 4% by June, the road to 2% remains bumpy, and premature loosening will lead to a flare-up in H2. Chinese pent-up demand is to be watched closely in H2. Excess savings for Chinese HH is still more than $700 billion.
Commodities Outlook: Oil should trade sideways; $ 100/b looks unlikely (a likely bottom at $70/b for Brent). Refined product inventory like gasoline is at multi-year lows, which should support prices. Other industrial commodities should also remain weak as recession engulfs the West and the Chinese property sector remains a non-starter.
Equity Markets: Market rally is due to liquidity, positioning and sentiment. Look out for BoJ policy on 28th April for liquidity. Moreover, the sentiment is turning slightly bullish as earning season commences. As a result, the rally might fizzle out soon. Expect negative returns this year for S&P 500.
No Room For Error! was originally published in DataDrivenInvestor on Medium, where people are continuing the conversation by highlighting and responding to this story.


Comments