There Is A Compelling Case For A Fed Action Which Will Create Ripples Across Global Financial System!
The present business cycle is exceptionally unusual as it has elements of the 40s fiscal recklessness, 70’s energy crisis and stagflationary period along with multiple variable lags, making it crucial to analyze the various moving parts in depth and then join the dots.
The data indicates that the dislocation across the supply chains caused by a ruthless pandemic has now healed. Nevertheless, the war and the subsequent sanctions on the FX reserves of Russia created FUD (Fear, Uncertainty and Doubt) among nations about the US being the safest destination to invest their surplus dollars.
Among all the chaos, the macro environment continues to deteriorate as a confluence of factors makes the largest economy in the world vulnerable to a sweeping decision that has the potential to cause ripples across the global financial system.
Today, we will dig deep into the 40s era and compare it with today’s scenario.
Also, we will analyze the various macro headwinds that the US currently faces and then examine the potential outcome.
Let’s go!
The 40s Explained!
WW2 ravaged the West, and the devastation took a heavy toll on the economic and human front. Millions of people died in the war, and billions of dollars were spent to win the war unleashed by Adolf Hitler.
There are two parts to how WW2 impacted the USA, which not only came out victorious, but the economic might have been unparalleled since then.
PART 1: When the US entered the war in 1941, unemployment was still high, and the economy was still healing from the Great Depression-inflicted wounds.
WW2 was a blessing in disguise as the labor force expanded massively to accommodate 3.25 million women. Furthermore, the unemployment rate crashed to 2% from a high of 25%.
The Government took on unprecedented debt, and the spending skyrocketed to more than 40% of GDP to finance the “costliest” war ever.
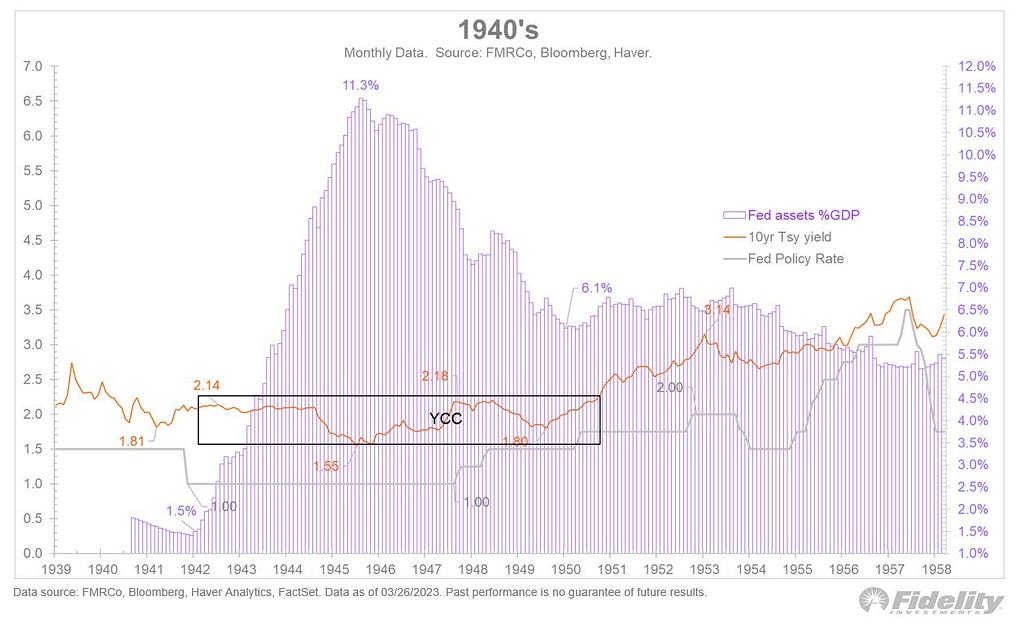
Public Debt ballooned to more than 100% of GDP, and undoubtedly, the gigantic deficit that the US government ran was monetized by the Federal Reserve as it printed an insane amount of money ( Assets jumped to more than 11.3% of GDP from virtually nothing).
NOTE: The Fed implemented YCC (Yield Curve Control) when the war started and continued until 1950. (We will understand later why till 1950)
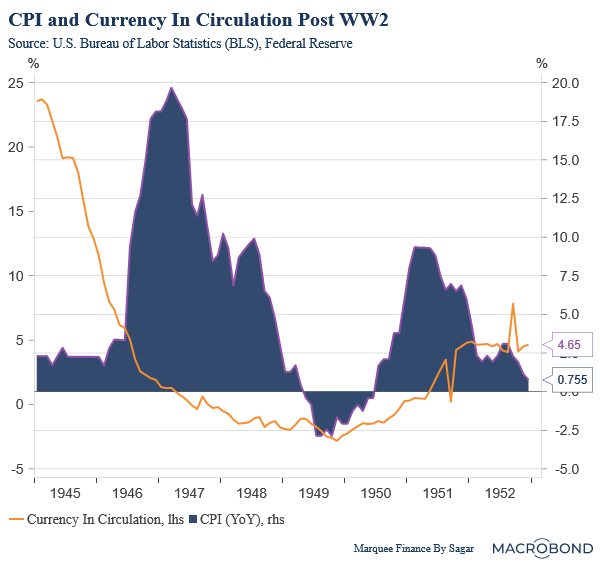
The massive stimulus meant that the currency in circulation (M2 data is unavailable for the period) shot up by more than 25%.
What happens next?
PART 2: Yes, folks, inflation was rampant as the money supply zoomed post-war.
Inflation in 1946–47 peaked at 20%, and plunged as the Money Supply came down.
Nevertheless, the baby boom that followed post-WW2 meant that the nominal GDP1 growth remained strong for decades.
(Rich Demographics were a significant driver of growth for decades to come)
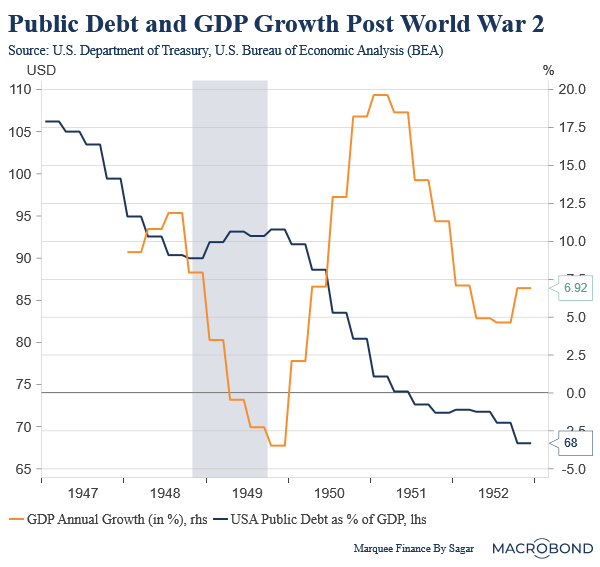
In the initial period post-war, the US saw double digits nominal growth aided by high inflation. The recession of 1948/49 was short-lived, and the economy rebounded sharply.
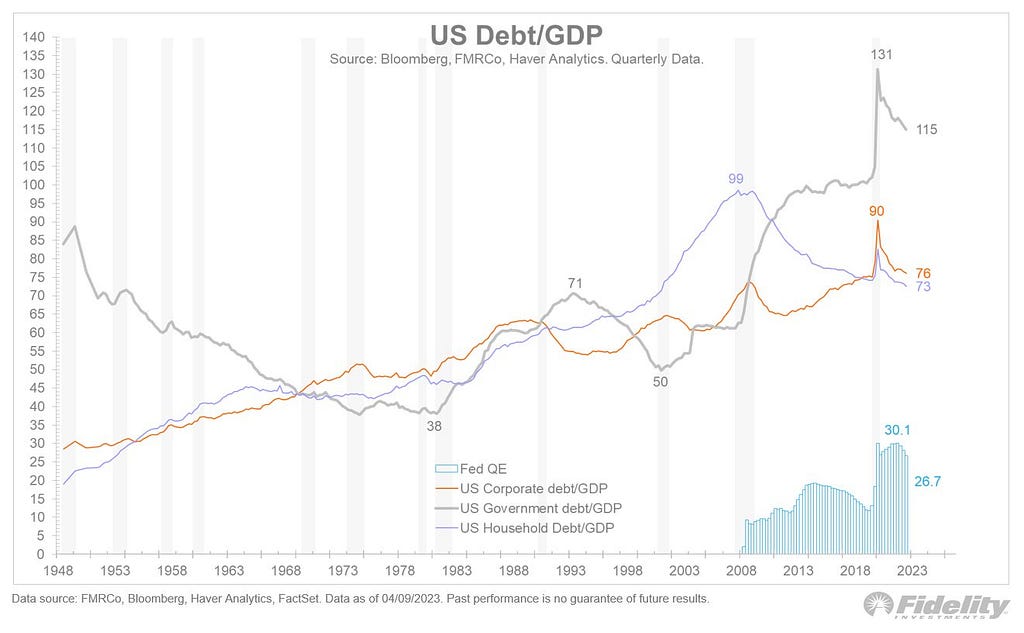
As a result of high GDP Growth, the Government Debt/GDP, which zoomed past 130% during the war, came down to 75% by 1950.
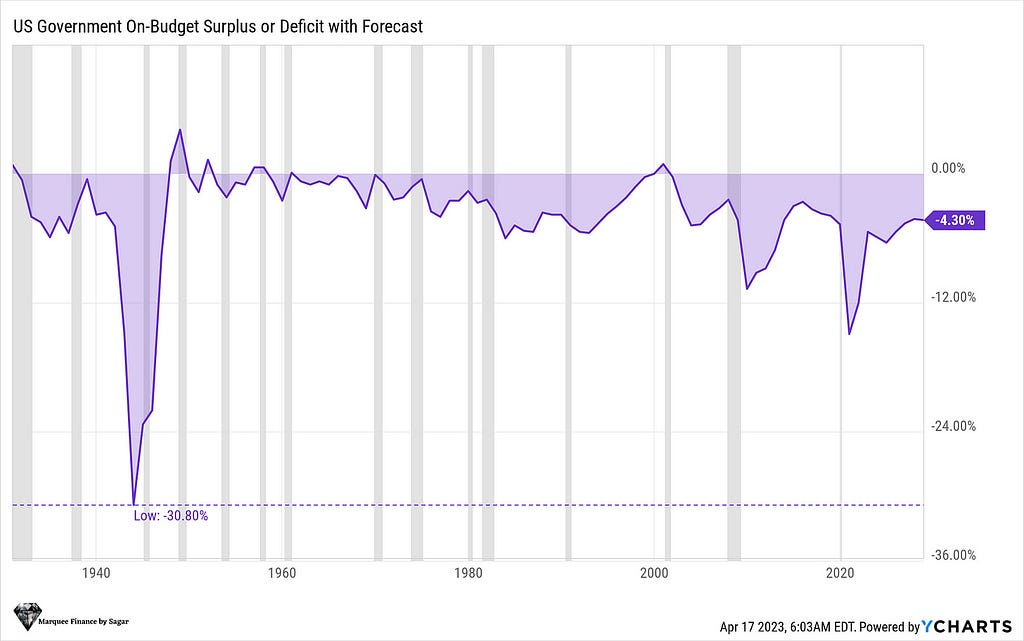
The YCC2 by the Fed helped rein in the government’s interest payments, and the booming economy meant that the US economy partially turned budget surplus from a massive deficit of 30% of GDP during the war.
As a result, the confluence of factors led to a drastic fall in the Debt/GDP ratio to manageable levels, the Fed’s Assets to GDP fell to 6.1%, and the US finally exited the YCC.
Comparison Of The 40s To Today!
Many market participants have compared the post-covid gargantuan fiscal response to the 40s fiscal stimulus.
It’s imperative to note that there is merit in their reasoning, as such an enormous loosening of fiscal purses has no historical precedent except the 40s.
One of the reasons is that similar to the 40s, tax receipts plunged due to nationwide lockdown and a complete halt of economic activity.
As a result, the budget deficit increased massively to more than 15% of the GDP in 2020.
Nevertheless, our aim is to predict the future as our ultimate goal is to make money using macro forecasting/developments.
Generally, running large “persistent” fiscal deficits3 is inflationary by nature.
As per this great NBER Paper released in December 2020, which ironically correctly predicted the current inflationary episode:
“The unprecedented peacetime deficits and monetary accommodation raise the risks of sustained (money growth-fueled) excess demand.”
NOTE: One should read the NBER Paper in detail to understand the implications of running large unrestricted fiscal deficits for a long time.
Today, the problem is compounded by the fact that the high Debt/ GDP and higher yields mean that the interest costs will spiral out of control in the near future.
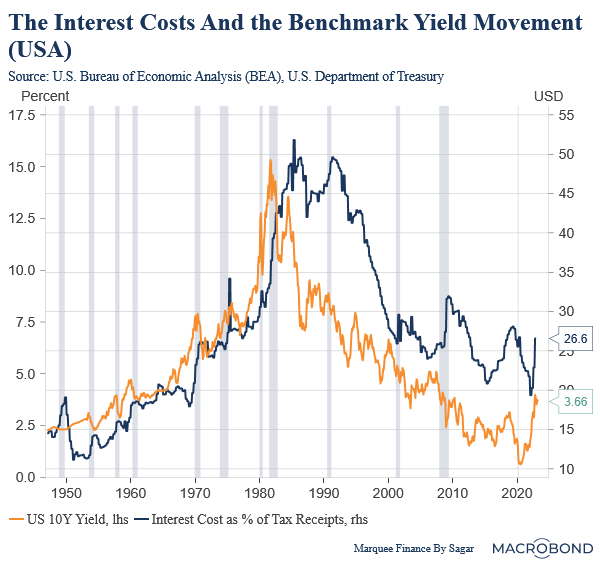
The decades of the 1950s to 1980s were marked by rising yields as a burgeoning middle class, a baby boom, and repeated wars in the Middle East meant that the sovereign Debt/GDP fell from to just 38% by 1982 (high real GDP growth, and high inflation), the interest cost as % of tax receipts continue to move higher and higher.
In fact, when Volcker raised rates to a record 20%, the interest costs of the federal government as % of tax receipts skyrocketed to an unbelievable 50%!
Yes, folks, US Govt paid 50% of its tax receipts as Interest costs!
Nevertheless, three decades of falling interest rates and a financialization of the economy meant that while the interest costs as % of tax receipts fell to 20% in 2020, but the Government Debt/ GDP went up dramatically to 131%!
As a result, the US government is now in a big fix as the “macro” headwinds galore.
Let’s understand the outlook now.
Back To The Yield Curve Control(YCC)?
The several challenges that the US economy faces:
- Rising Interest Costs as % of Tax Receipts: If the rates remain in the 3–5% zone for the next 2–3 years, we might see the figure touch as high as 40–50% because it’s different than the 80s now (Debt/GDP is exceptionally high, so the magnitude of the rise will be swift).
- With a slowing economy and a looming recession, the fiscal deficit might surge again as tax receipts plummet. An uncontrollable fiscal deficit means that higher fiscal-induced inflation and the continuation of the debt binge.
- One of the macro tailwinds for the US economy in the 80s was the young demographics which meant lower social security and healthcare costs. As the demographics decline (a secular change) (I covered it in detail here last year); it is nearly impossible to return to fiscal prudence (or reduce deficit materially)
The grim macro outlook means that the only solution currently visible is the Yield Curve Control (YCC) in the US, which will help curb the interest costs while inflation remains elevated.
As a result, the Debt/ GDP ratio will be gradually reduced to manageable levels of 70–80%.
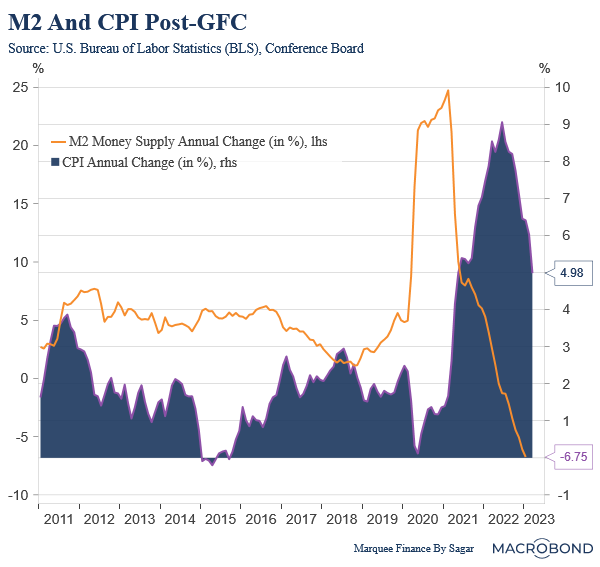
Nevertheless, some monetarists believe that inflation will plunge as the money supply collapses.
This transpired in the 40s but remember that the government ran a fiscal surplus (taxes were as high as 92% for the wealthy back then- check the first image of the last section).
The current doom loop means that YCC in the US is inevitable, and inflation might remain elevated (3–5%) for many years.
In such a stagflationary4 scenario, it’s hard to conclude the equity markets as some sectors might outperform due to high nominal earnings, while others might underperform.
Gold should outperform long-term bonds (TLT).
A YCC also means that Fed’s balance sheet will likely expand massively (akin to BoJ) as it monetizes the debt, and the money this time should flow to Emerging Markets, and hard assets and RoW (Rest of the World) should outperform the US.
Conclusion!
We always consider various scenarios and assign probabilities accordingly. The current macro scenario post joining all the dots means that there is a high probability of a Yield Curve Control (YCC) in the US, which will have the following ramifications:
- An enormous increase in the Fed’s balance sheet as it monetizes the US Government Debt.
- A case for elevated inflation (3%+) while the economy dives in and out of recession, similar to the 70s (it will be a “fiscal shock” instead of an “energy shock” this time)
- A stagflationary scenario where real assets will outperform financial assets. So agricultural land outperforms stocks or Gold outperforms TLT.
- A weaker dollar that would boost commodities and Emerging Market (EM) stocks.
This looks a high-probability event; however, the risks to this remain a credit event which might force a hard landing and lead to the Fed aggressively cutting rates (A growth plunge leads to the collapse of inflation for a few quarters before it rebounds again).
Back To The Future! was originally published in DataDrivenInvestor on Medium, where people are continuing the conversation by highlighting and responding to this story.
Comments