Confused About The Global Macro Landscape? Read this!
Investopedia defines a business cycle as “concerted cyclical upswings and downswings in the broad measures of economic activity — output, employment, income, and sales.”
A few months back, I wrote about how the “HOPE” model best explains the variable lags in the economy and is the correct sequence to identify the business cycles.
Housing → Orders → Profits → Employment
The biggest mystery remains where we are presently in the business cycle. Since the current paradigm has no historical precedence, we must continuously evaluate the incoming data and update our portfolios accordingly.
Today, we will dig deeper into the Housing data, ISM numbers, Chinese data, and European data and look at the developments in Japan.
US Housing and ISM!
Housing remains the leading indicator for the economy. There has been recent chatter among the market participants that housing has “bottomed” out and is on the path to recovery.
The “no landing” or the soft landing camp believes in the bottoming out of the housing market.
Since I have been for a long time involved in the family’s real estate business, I want to shed light on the three most significant factors that propel the housing market:
- Sentiment: The biggest driver of the housing market is the buyer’s sentiment. The housing market activity remains robust if the sentiment is positive (unemployment low, GDP growth strong, prices rising, low mortgage rates).
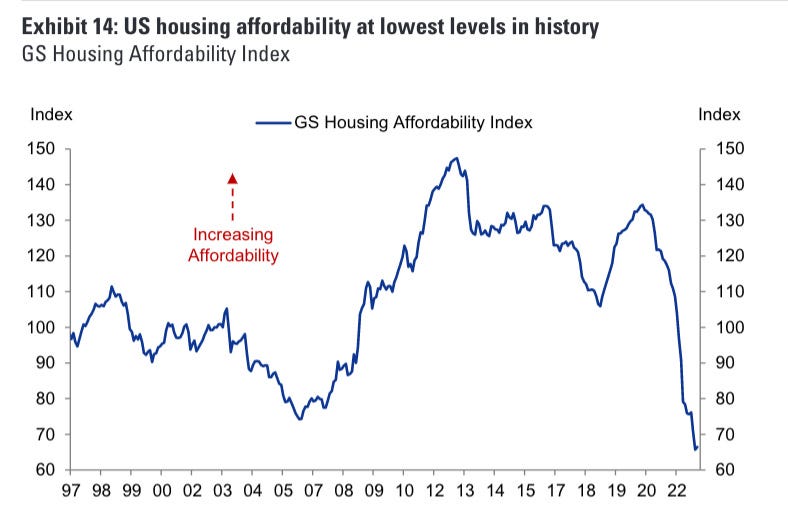
- Affordability: The second biggest factor that influences the housing market is affordability. The RE market runs dry if the affordability plunges, and vice-versa.
Unfortunately, today due to the insane rise in prices post covid and the highest mortgage rates since 2007, housing affordability remains at its lowest levels in “history.”
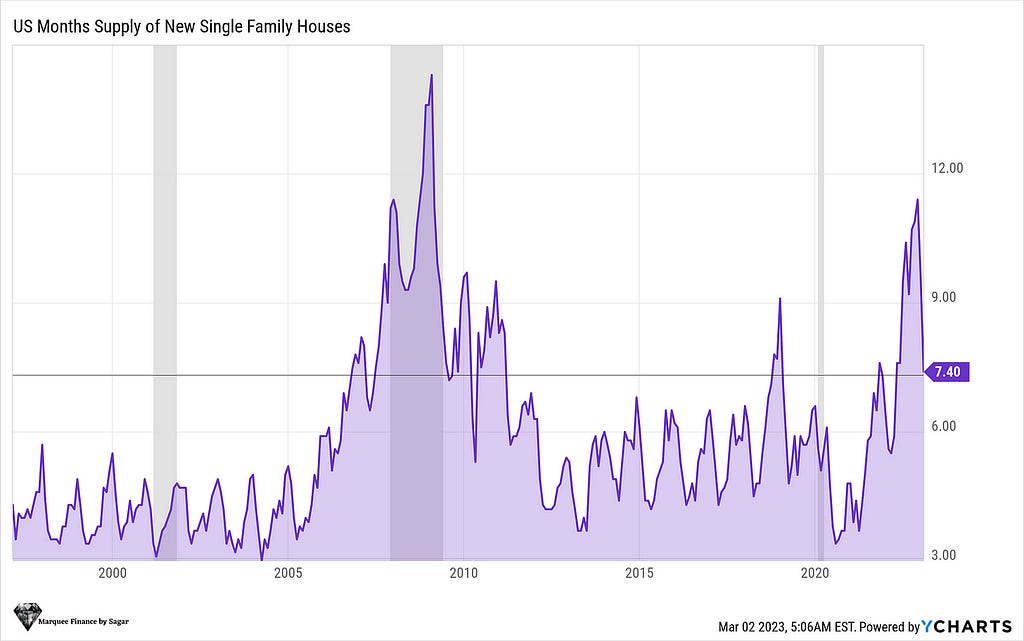
- Supply And Demand: In a housing downturn, the supply and leverage determine the extent of correction. The 2008 GFC witnessed one of the worst drawdowns on record as the housing market had a tremendous oversupply and was over-leveraged.
The current drawdown is expected to be around 15–20% (I covered all the dynamics last year here), as the demand-supply balance is much better than in 2008. (Though uneven across cities due to post- covid reverse migration)
Nevertheless, we have recently seen intriguing trends in the housing market.
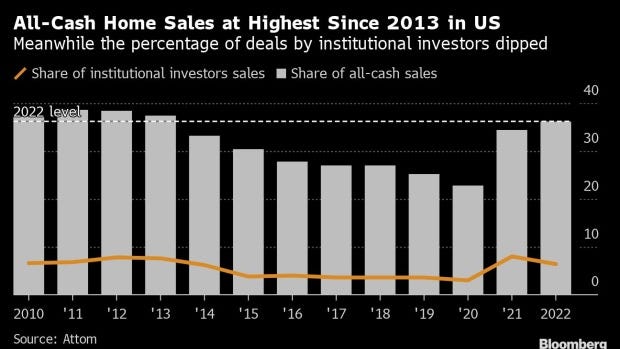
- Cash Purchases: As the mortgage rates cross 7% once again, the percentage of all-cash home sales has hit the highest levels since 2013.
- The trend indicates that buyers are unwilling to take a mortgage to purchase homes, but since consumers are hoarding excess savings and the unemployment rate remains low, the housing market is still crawling. However, this might change once the scenario reverses on both fronts.
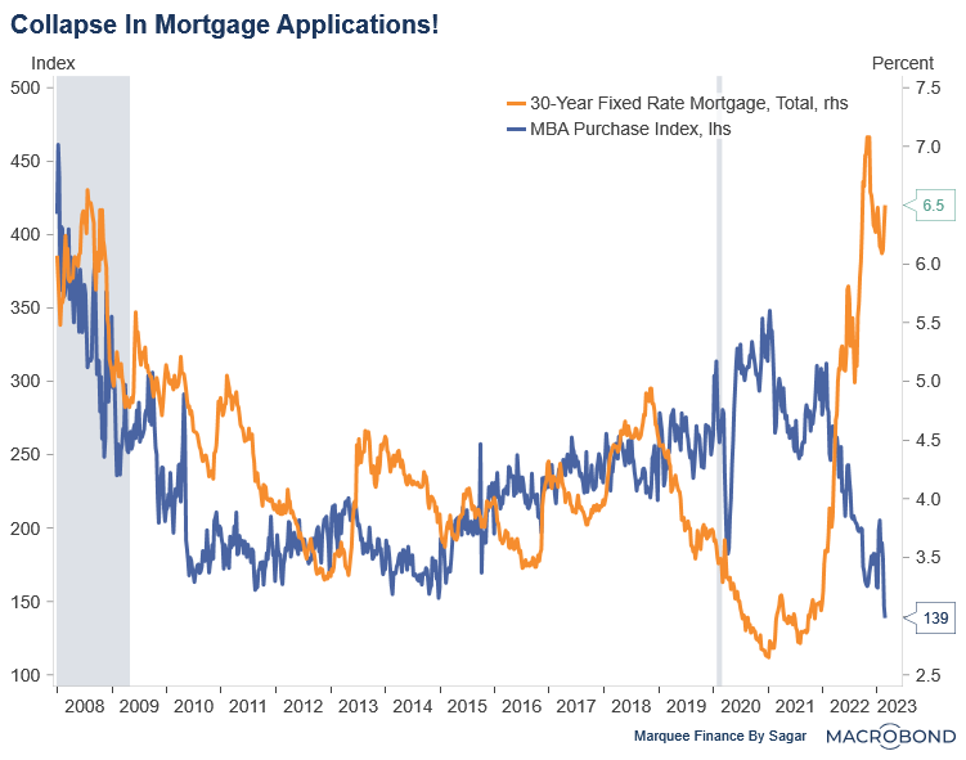
The weekly MBA Application survey offers a comprehensive analysis of mortgage application activity, and unsurprisingly it’s a one-way down.
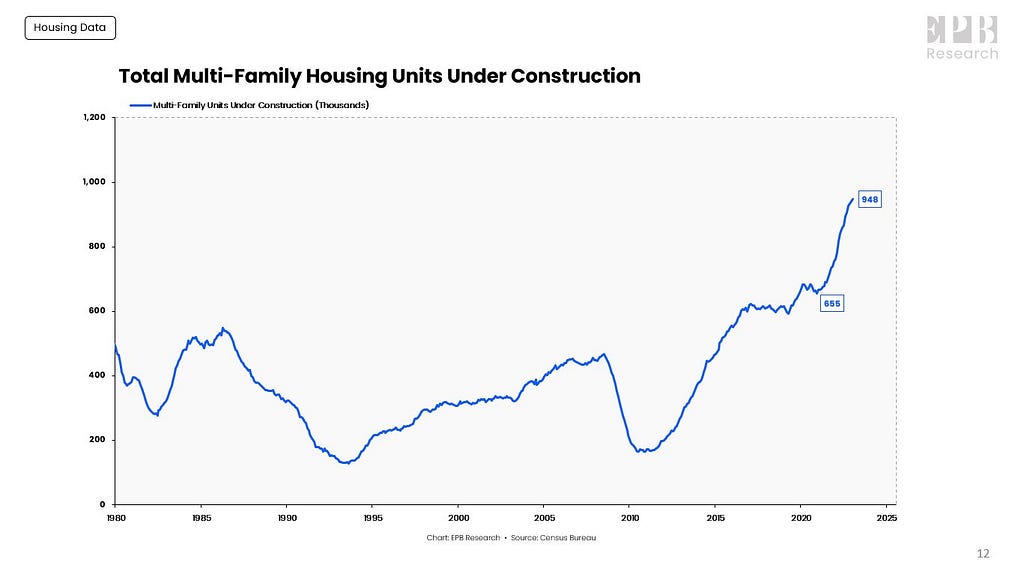
- Multi-Family Housing: While the activity in single-family homes has been subdued due to the Fed’s unprecedented tightening, multi-family housing is still robust and accounts for most of the construction spending.
This “unprecedented” boom in multi-family housing was also due to heightened institutional activity. However, as the appetite to start new units remain low, we might see the activity in multi-family housing come to a grinding halt in the next 2–3 quarters.
- Homebuilder Discount: As the higher mortgage rates deter buyers, homebuilders have begun offering enormous discounts via subsidizing loans as they are reluctant to reduce prices further. Nevertheless, homebuilders can give an impetus to sales “only” in the short run.
Higher for longer can ruin their party, and they may have to reduce prices further if there is a drastic fall in their liquidity.
Overall, the housing market is flashing warning signs but seems to be consolidating before another 5–7% drawdown (median price of new homes).
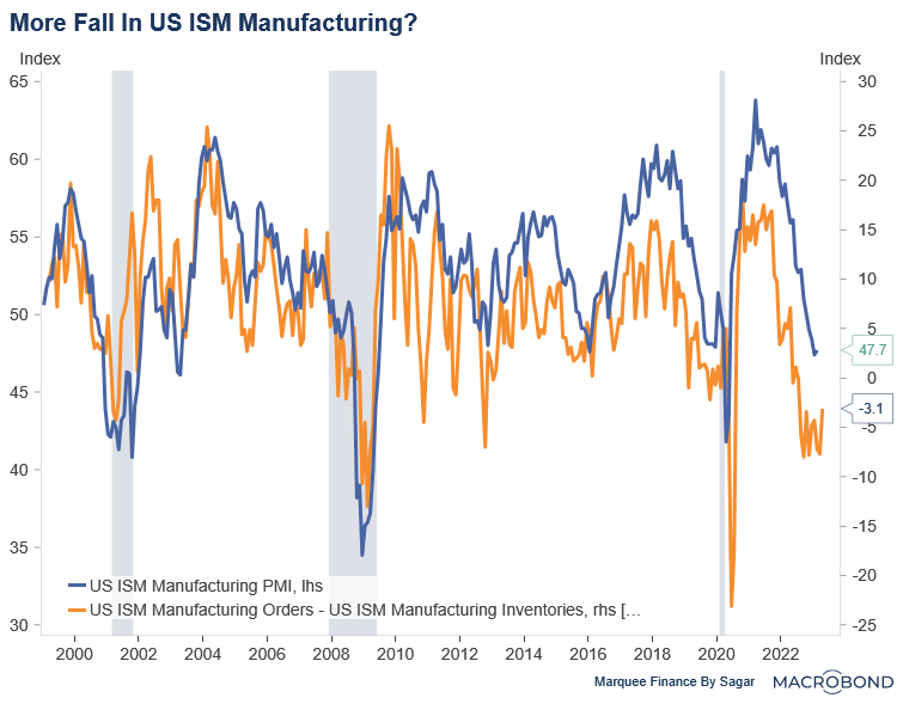
As housing continues to falter, the ISM, another leading indicator, is portraying a horror picture.
The spread between New Orders and Inventories lead the headline ISM number by two months.
While the headline number is still in the contraction zone (less than 50 indicates contraction), it is expected to remain sideways.
Nevertheless, the astounding dataset in the ISM release was the prices paid, which exceeded the consensus by a considerable margin and has now rebounded to 51.3, signifying that the pricing pressures are back with a vengeance.
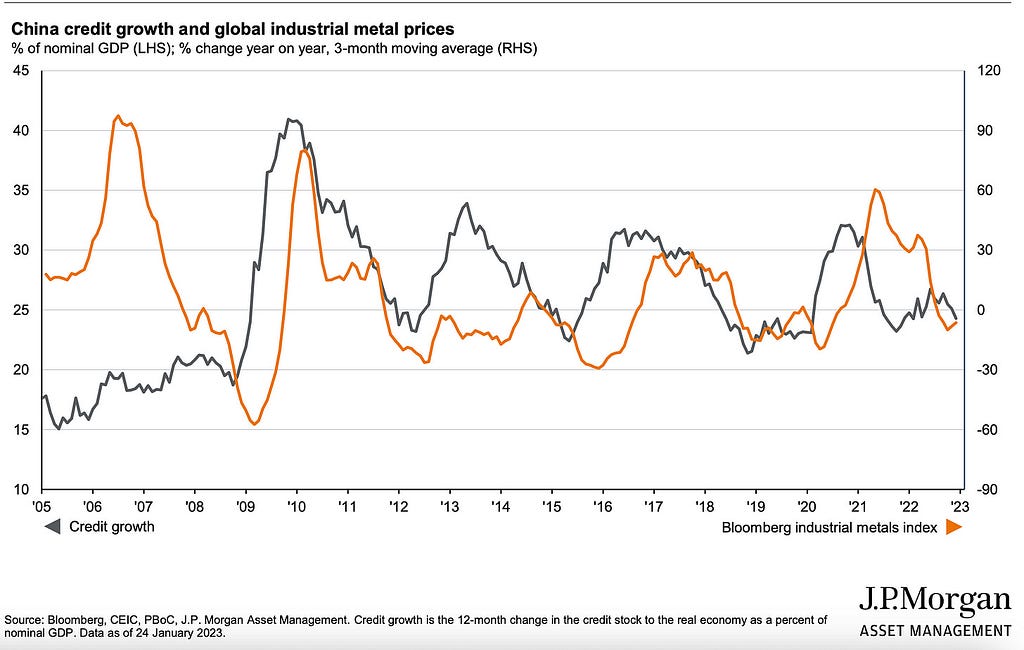
Well, I believe the current rebound in prices paid is due to the commodities rally late last year post the Chinese reopening. However, a status quo on commodities might be a headwind for the prices paid in the near future.
ISM points out low growth and persistent inflationary pressures, which do not bode well for the company’s margins. The data also mounts pressure on the Fed to keep the rates “higher for longer” as the contraction in cyclical activity has had a negligible effect on sticky inflation until now.
The “Great Margin Squeeze” is upon us (“P” in the HOPE model), and the industrials might underperform when reality sinks in. We have already witnessed that operating margins for S&P 500 have plunged 150 bps from the highs last year and are on track to reach pre-covid levels before the end of the year as per consensus.
Europe!
Potentially facing an “inflationary” crisis greater than the Fed, ECB’s problems have been compounding off late.
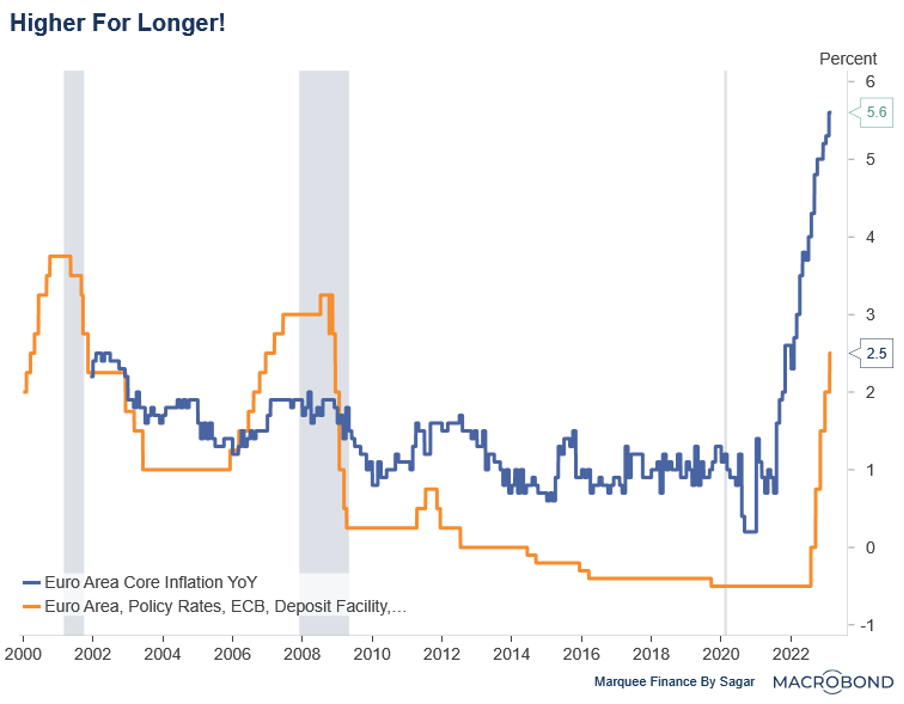
With the data releases in Eurozone this week, it has become more apparent that ECB was way behind the curve and is losing the inflation battle.
The core inflation (ex-food, energy and tobacco) came in at the highest 5.6% YoY since the inception of the Eurozone, signifying that the inflationary pressures induced due to the energy crisis post-war have now spilled over to the broader economy.
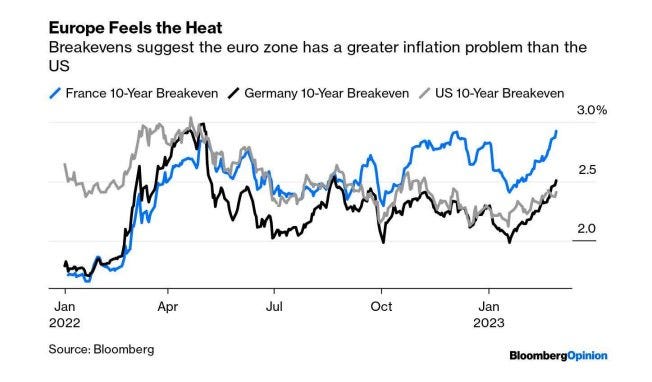
In fact, services inflation has seen a monstrous rise in France and Germany. As inflation seems embedded in the economies, the consequences have been disastrous for the ECB, which had, until now, boasted of well-anchored inflation expectations.
The breakevens in France and Germany are now approaching post-war highs.
As a result, in a mind-boggling development, bond markets have pushed the ECB’s terminal rate to 4%, way above anybody’s wildest expectations a few months back.
The tightest labor market on record (the lowest unemployment rate ever) and the net savings position in Europe make the ECB job one of the world’s most challenging and increase the odds of a hard landing.
Net Savings Position: Since Europeans are net savers, a rise in bank deposit rates will augment household income and positively affect disposable incomes, thus stimulating consumption.
The East: China and Japan!
While the West resorts to unprecedented monetary tightening and flush out excess liquidity via enormous Quantitative Tightening (QT), the East continues to pump in record amounts of liquidity.
On several occasions in the past two months, I have talked about this anomaly (West V/S East) and how the Chinese reopening will be the most significant catalyst for global flows and markets this year.
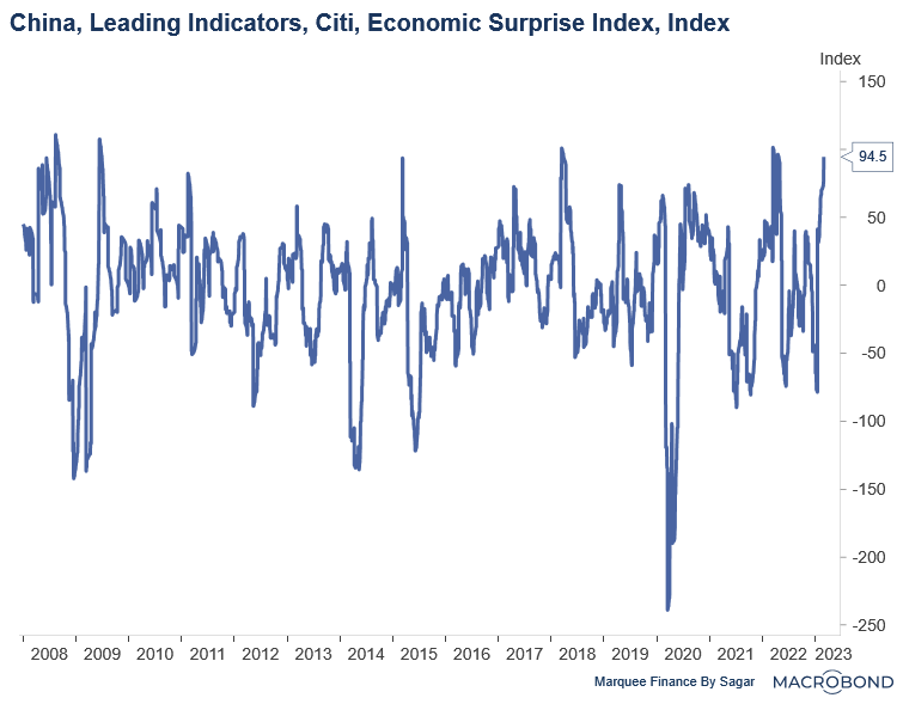
The data coming out of China is now surprising on the upside.
The reopening has picked up the pace, households are deleveraging (increasing disposable incomes), and the PMI data confirms that the animal spirits are back. In a stunning rebound, Services PMI came in at 56.3, the highest since 2012.
Furthermore, PBoC continues to pour massive liquidity to support the battered economy. However, the property sector remains a laggard which may keep a lid on growth going forward.
One should closely track the Chinese credit impulse to look at the commodities’ action.
The Bank Of Japan (BoJ) finally saw Kuroda exiting office after a tumultuous decade, which saw colossal monetary easing and printing of money.
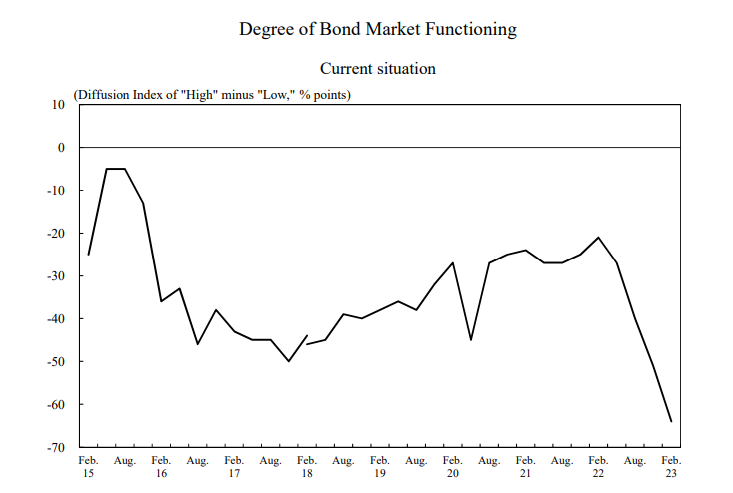
The result has been a dysfunctional bond market where BoJ remains the biggest holder (owns around 55% of all outstanding JGBs)
The new Governor at the helm is Kazuo Ueda, who will be known in history as the man responsible for altering the course of the BoJ’s “ultra-loose” monetary policy.
However, some market participants anticipate that Kuroda will do the inevitable (abandon YCC) in his last meeting as the Governor. (remember “Endgame”)
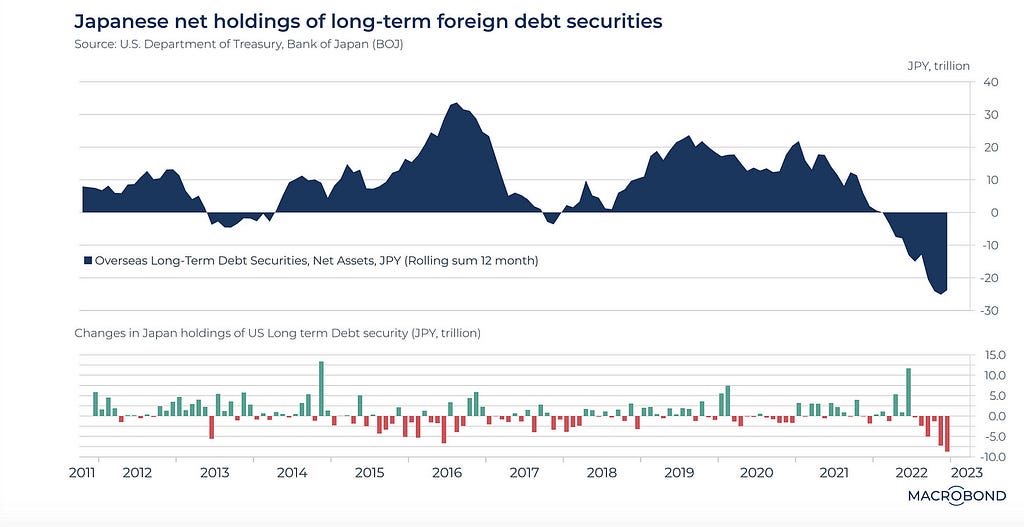
As the policy normalisation ensues (March or June), the resulting massive exodus of Japanese investors from foreign bond markets will be the most important news of this year in Japan.
The trend is alarming and will create ripples across the bond markets in the US and Europe later this year when QT dries up the liquidity.
You can’t ignore Japan in the global macro puzzle.
Conclusion!
The Western CBs are fighting a “monster”, a creation of their own doing. They can only defeat the “monstrous” inflation by inducing a recession.
The cyclical activity confirms the slowdown, but the pricing pressures remain elevated due to the commodities rally late last year. The residential housing market activity continues to decline in the US and Europe, and the commercial real estate market is witnessing rising defaults as refinancing at current rates become unviable.
Though a lot of excess liquidity is sloshing around the system, as observable from loose financial conditions, the scenario might drastically reverse in the year’s second half.
As BoJ normalizes the policy, QT picks up the pace in the West, and monetary transmission affects the economy, predominantly by the end of H2; equities and corporate credit will bleed red.
Don’t ignore the warning signs!
Solving The “Macro” Puzzle! was originally published in DataDrivenInvestor on Medium, where people are continuing the conversation by highlighting and responding to this story.

Comments