The Current Paradigm Has A lot Of Moving Parts!
In today’s world of information overload, numerous narratives run wild across social media as everyone has their stakes involved: political affiliation, trading positions or arm-twisting from the top brass at big firms.
Undoubtedly, the noise is excruciating for someone looking to get a fair view of the markets and position their portfolio according to the incoming macro data.
While connecting the dots, you can’t be 100% correct, and life, as we say, is an eternal learning process. I hope I continue to share, learn and present an impartial view of the markets.
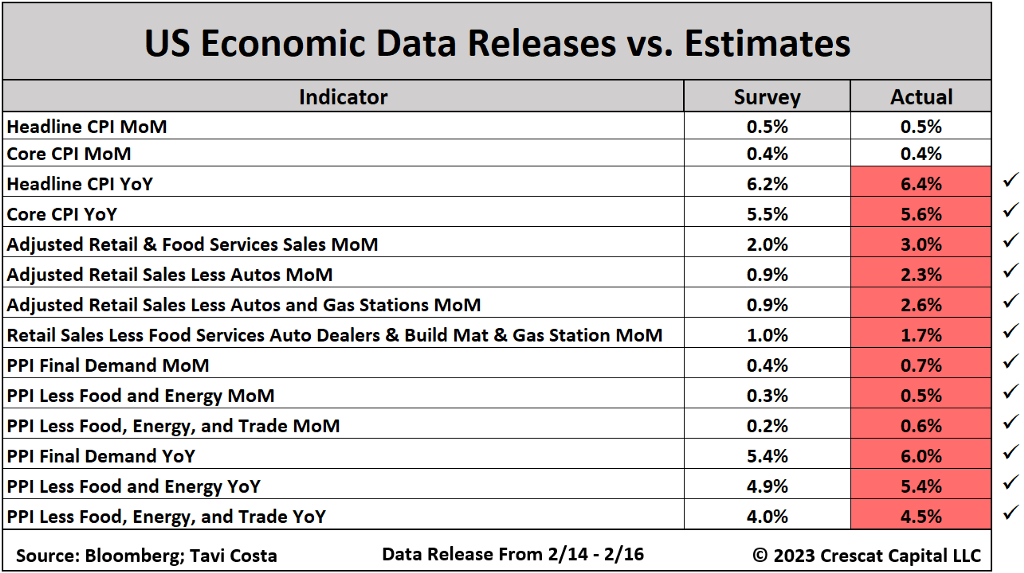
This week’s noise was absolutely about the inflation data, which has become the most watched data point in the last year. But one can’t complain as the data is riddled with anomalies, and inflation remains the economy’s lagging indicator.
Today, we will decode the inflation and other economic data and join the dots with what’s happening in the energy markets and the world’s second-largest economy.
The Most Anticipated Data Release!
The inflation data has seen a host of changes this time. There was a significant methodology change, massive seasonal adjustments and major revisions (unfortunately, on the upside).
We also saw that some of the components of the CPI remain lagged, which distorts the true picture.
Lately, we have also seen that used car prices, the most significant source of disinflation, have started to pick up. However, the January CPI still reported that used car prices are falling.
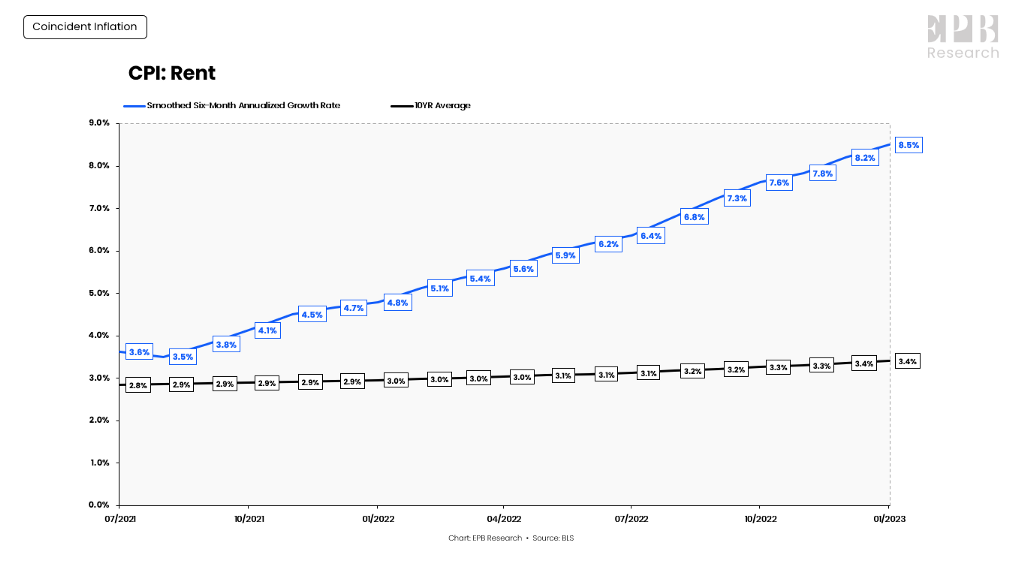
Furthermore, the Shelter prices saw the biggest increase since 1982, when in fact, in real-time, the index peaked somewhere around October (coincides with the peak in mortgage rates).
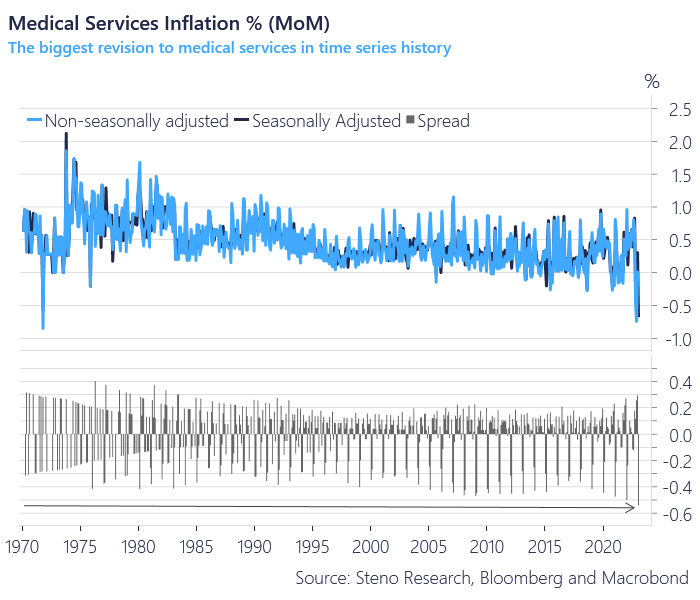
The other surprise in the inflation data was the most extensive revision on the downside to the medical services inflation “ever”, which can be attributed to the weird way the health insurance data is reported.
Lastly, when we calculate the CPI less shelter on the smoothed six-month annualized basis, we get a number of around 3.5%.
If we dig deep into finer details, we can analyze that last year when inflation peaked, the CPI less shelter was running at 11.8% when the headline print was 9.1%.
Notably, the headline CPI has now moved down to 6.4% from the high of 9.1%, and CPI less shelter to 3.5%, as goods disinflation picked up pace led by the used car prices.
Therefore, it is further expected that the headline number will move to 4–5% (as shelter peaks in a month or two) by the end of H1 and as the base effect also kicks in (remember the spike last year post-the war)
Nevertheless, the real story will unfold in H2 as bringing inflation down from 4% to 2% will require much effort as wages measured by AHE(Average Hourly Earnings) are still growing at 4%+.
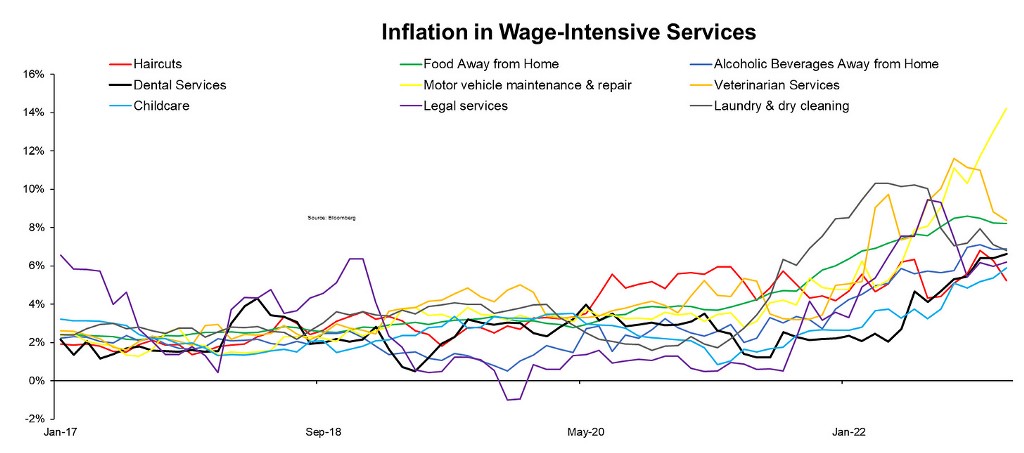
Furthermore, when we closely look at the wage-intensive services sector, which has been the pain point, as we discussed last week, the wages are still growing at more than 6% across the board, making real wages positive and boosting consumption.
The other significant release was the retail sales data which was expected to beat consensus as we have read the eye-popping headlines about the US consumers binging on credit card debt which exploded to all-time highs and still using their excess savings estimated at $1.77 trillion to spend. So, undoubtedly, it did massively surprise on the upside.
The other major data releases for this week were the Industrial production data, a coincident indicator and was expected to fall due to the ISM New Orders (leading indicator) collapse witnessed earlier. In fact, the prior month’s revisions were on the downside, confirming the slowdown.
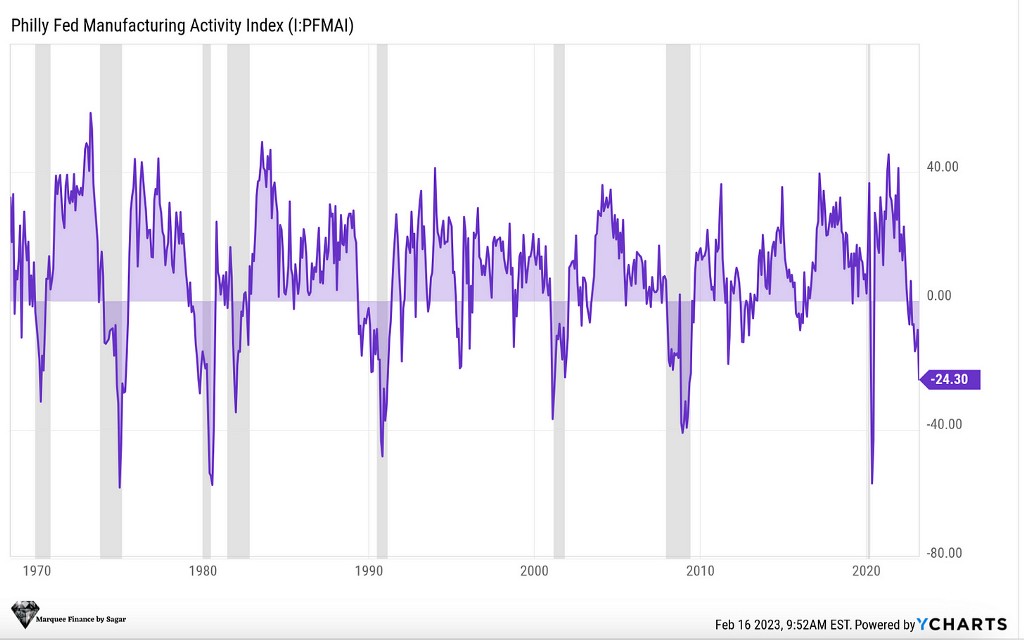
The Philly Fed’s Manufacturing Activity Index came in lower than consensus cognizant with a recessionary economy.
The surprise was that the prices paid increased, thus confirming the pricing pressure that the firms are reeling with.
Further confirming the trend was the PPI which came in hotter than expected, leading to concerns that firms’ margins might come under pressure as the pricing power fades due to the anticipated economic slowdown.
The economic releases point out that while the cyclical part of the economy is slowing (further confirmed by the weak housing data), inflationary pressures across services remain sticky as consumers who deleveraged during the pandemic are now using leverage to spend.
The Oil Markets!
“Global oil demand is set to rise by 2.0 mb/d in 2023 (revised from 1.9 mb/d and 1.7 mb/d from January and December, respectively), to a record 101.8 mb/d, with nearly half the gain from China.”- IEA.
The oil markets witnessed a turbulent few days as Russia, “without consulting” OPEC+, decided to reduce their oil output by 500k b/d from March in retaliation against the western sanctions and then in the retaliatory move, the Biden administration decided to further discharge 26 mb/d (almost 269k b/d) from the Strategic Petroleum Reserve (SPR).
It is also pertinent to note that Russia had been pumping oil akin to pre-war levels (down only 2–3%). Therefore, it was always expected that Russia could do what it did with the gas supply to the EU.
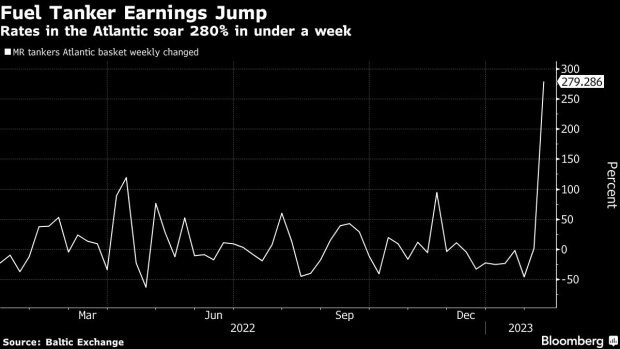
Furthermore, as the EU’s embargo on Russian refined products kicked in on 5th February, the fuel tanker markets witnessed a shakeout of epic proportions.
We discussed this last year in “Hanging In The Balance”, and it was no surprise that rates in the Atlantic soared by a whopping 280% in just one week!
The situation looks alarming when we look at the finer details of the energy market dynamics. The physical market remains tight, along with the refining capacity.
Furthermore, suppose the oil demand rebounds to pre-pandemic levels in China. In that case, the demand might outstrip supply, especially in a scenario when Russia might voluntarily cut supply further by a million barrels or so.
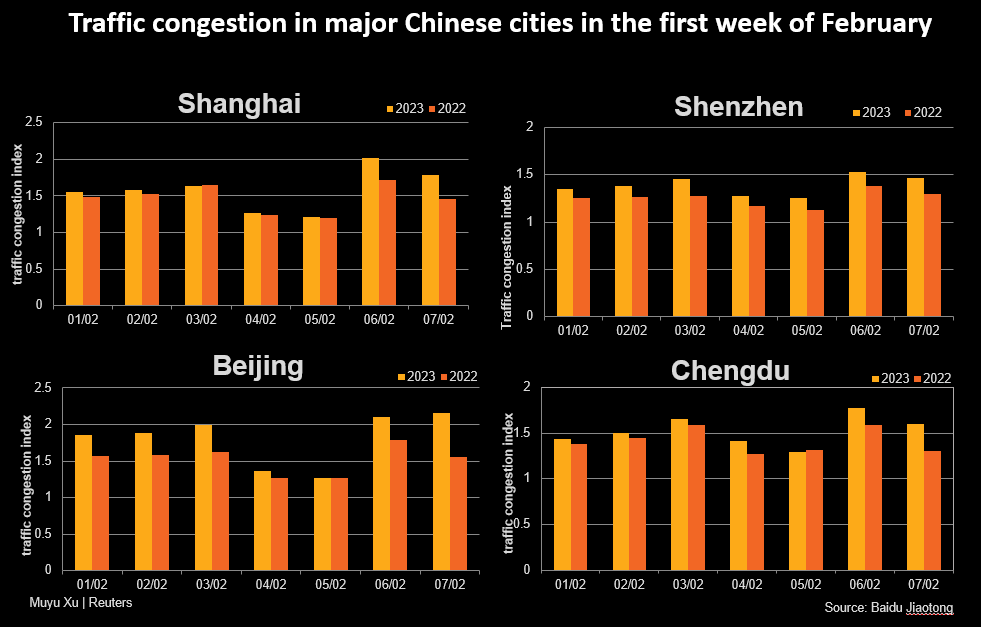
Already, data from Chinese indicates that the traffic congestion in major Chinese cities has surpassed last year’s levels, thus boosting the oil demand.
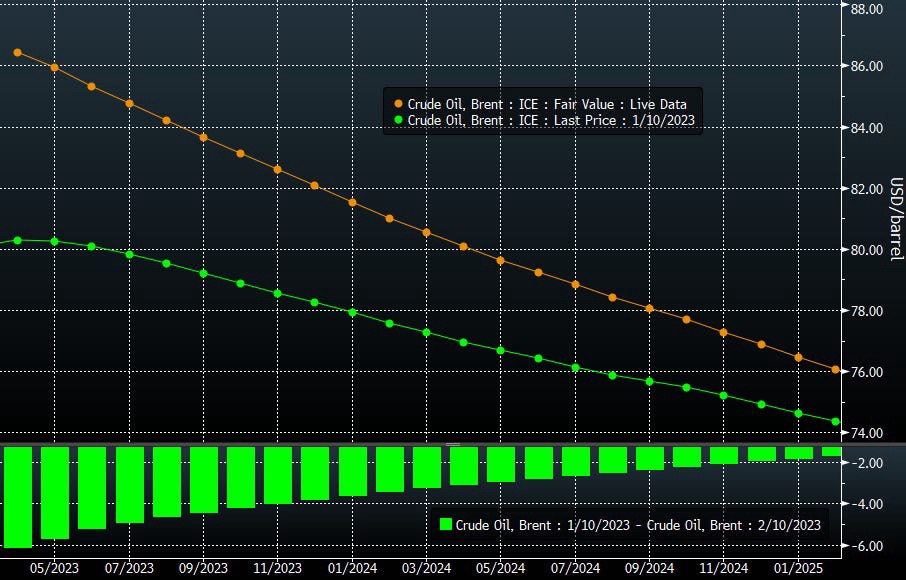
Smelling the developments in the energy landscape, the brent curve is now in backwardation which is a bullish signal for oil prices.
Source: Ole S Hensen
The backwardation has now popped up to 50 cents or 2% as IEA continues to revise the demand numbers on the upside.
Those hoping for inflation to come down to 3% should watch this space closely.
Chinese Trends!
We recently got a lot of data, and as I have constantly repeated, the Chinese reopening will be the biggest story of 2023. Hence, it is pertinent to observe the trends in the Chinese economy closely.
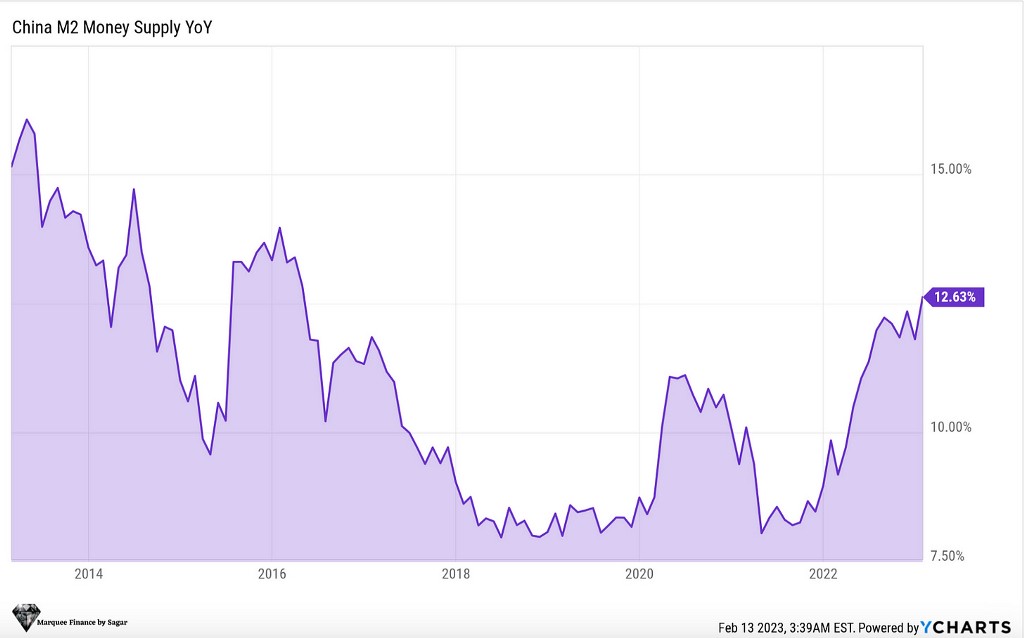
The first data we got was the Chinese M2 Money Supply which grew a staggering 12.63% YoY, albeit on a low base, at the fastest pace since April 2016. Nevertheless, this shows that the PBoC and the Chinese government remain firm on reviving the economy after a catastrophic Covid zero policy that did enormous economic damage.
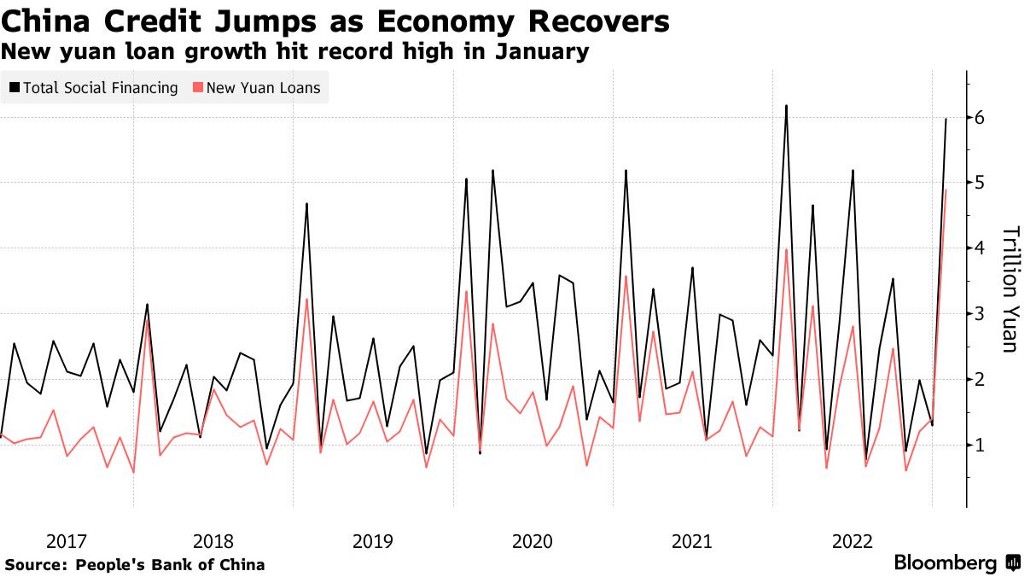
The other data we got was very intriguing, to say the Chinese credit data, which holds significant importance in terms of the rationale behind our Chinese exposure in the model portfolio. Remember that I predicted that the Chinese Credit Impulse would see a massive rebound and that household money would move to stocks rather than the ailing property sector (those who have not read can click here).
Well, folks, the early trends confirm the same. The data from Bloomberg:
New household medium and long-term loans, a proxy for mortgages, came in at 223 billion yuan, compared with 185 billion yuan in December and 742 billion yuan a year ago. Despite increasing government support for the property market, demand for housing remains subdued because of sliding home prices and weak growth in household incomes.
The HH demand from mortgages is still low despite a massive push by PBoC to revive the mortgage credit. Secondly, overall credit has been up significantly since last year as total financing increased by a record 9 trillion yuan ($719 billion) compared to 3.98 trillion yuan last year.
Corporate loans led the surge as the economy picked up pace led by the services sector after the swift reopening late last year.
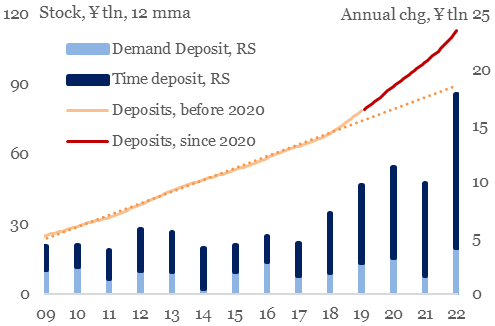
The divergence between the HH and corporate sector might sustain as Chinese citizens hoard a lot of excess savings.
Source: IIF Twitter
As per estimates, HH deposits are ¥20 trillion more than projected by the pre-Covid trend.
Furthermore, one needs to closely track the movements of outbound tourism from China, especially during the summers. The pent-up travel demand can do wonders for certain economies in SE Asian countries and Europe.
As the year progresses, we will closely examine the Chinese trade data, consumer loans, spending, the property sector and the credit impulse to gauge the impact on commodities and the Chinese equity markets.
Conclusion!
It’s imperative to note that when we join the dots, we get the following picture:
- Cyclical Activity Slowing → Manufacturing faltering, ISM down, Housing weak
- Services Holding Out → Consumers are still spending, taking on leverage, and draining excess savings.
- Chinese Reopening → Inflationary pressures might remain elevated as prices of industrial commodities remain buoyant.
- Oil Markets Bullish → Energy markets remain on edge after recent geopolitical events, and we are getting early bullish signals as the curve enters backwardation.
- Credit Markets & Equity Markets → Pricing in a soft landing or no landing.
While markets might remain complacent until H1, as inflation might continue to buckle down due to base effects and the shelter inflation normalizes, H2 might be one of the most challenging periods for the stock and credit markets.
Can You Join The Dots? was originally published in DataDrivenInvestor on Medium, where people are continuing the conversation by highlighting and responding to this story.

Comments