AMD's financial report is released tonight, how to lay it out?
$Advanced Micro Corporation (AMD) $It is expected to release Q3 earnings on November 4, 2025 (after market close EST). AMD management expects 3Q2025 revenue to be approximatelyUS $8.7 billion (± 300 million), median quarter-on-quarter growth of approximately13%, slightly above the market consensus$8.75 billion。 Corporate GuidelinesNon-GAAP gross marginApproximately 54%, operating expenses approximately$2.55 billion。 Although no EPS forecast has been released, analysts generally expect Q3 EPS to reach$1.17。 This means that AMD is steadily entering a new growth cycle driven by AI and data centers.
The biggest highlight of this season isMass production climb of MI350 AI accelerator。 AMD started mass production ahead of schedule in June, and is expected to "climb steeply" in the second half of the year to support large-scale deployment of multiple cloud computing and enterprise customers. Management clearly stated that,MI350 is the core factor driving strong growth in data center business, month-on-month (QoQ) will achieve double-digit growth. Market interpretation believes that this marks that AMD has finally entered the stage of large-scale delivery in the competition with Nvidia's AI accelerator.
Client business is expected to only be realized in Q3Single-digit sequential growth。 Although Q2 year-on-year growth was as high as67%, but the growth rate has stabilized. The game department expects Q3 to be basically flat, and Q4 will see a significant decline, mainly because console customers enter the off-season after completing inventory accumulation before the holiday. In other words, the AI business has become the only clear growth engine.
AMD management confirms that China'sMI308 GPU shipments have completely eliminated revenue expectations。 Due to U.S. export controls, the year-on-year growth rate of AMD's data center AI unit increased from Q157.2%Down to Q214.3%。 China is still AMD's second largest market, second only to the United States, with a difference of less than $2.5 billion. However, the company does not expect that the Q4 guidance will still include China-related revenue because the US-China "chip ceasefire agreement" has not yet been lifted. This means that China's sales will be difficult to recover in 2025, putting continuous pressure on gross profit margins.
AMD's GAAP gross margin in Q2 fell to43%, a full decrease from the same period last year10 percentage points (1000 bps), mainly due to export restrictions$800 million inventory impairment。 Q3 non-GAAP gross margin guidance is54%, excluding this one-time loss. Compared to competitors, Nvidia's gross margin exceeds70%, may reach the mid-70% range before the end of the year, and AMD still has a significant gap in profitability. However, as the MI350 series increases in volume and the impact of inventory is gradually digested, analysts generally expect AMD's gross profit margin to continue to recover in 2026.
AMD's Q3 financial report will be fully focusedVolume performance of AI accelerator and data center business。 The slowdown in client business growth, the adjustment of the game department, and the almost shutdown of the Chinese market mean that the company's short-term growth depends almost entirely on the success of MI350. However, early mass production, strong customer demand, and a wave of investment in AI infrastructure have made AMD one of the manufacturers with the most explosive potential in this round of AI hardware cycle.
How has AMD performed over the past few earnings seasons?
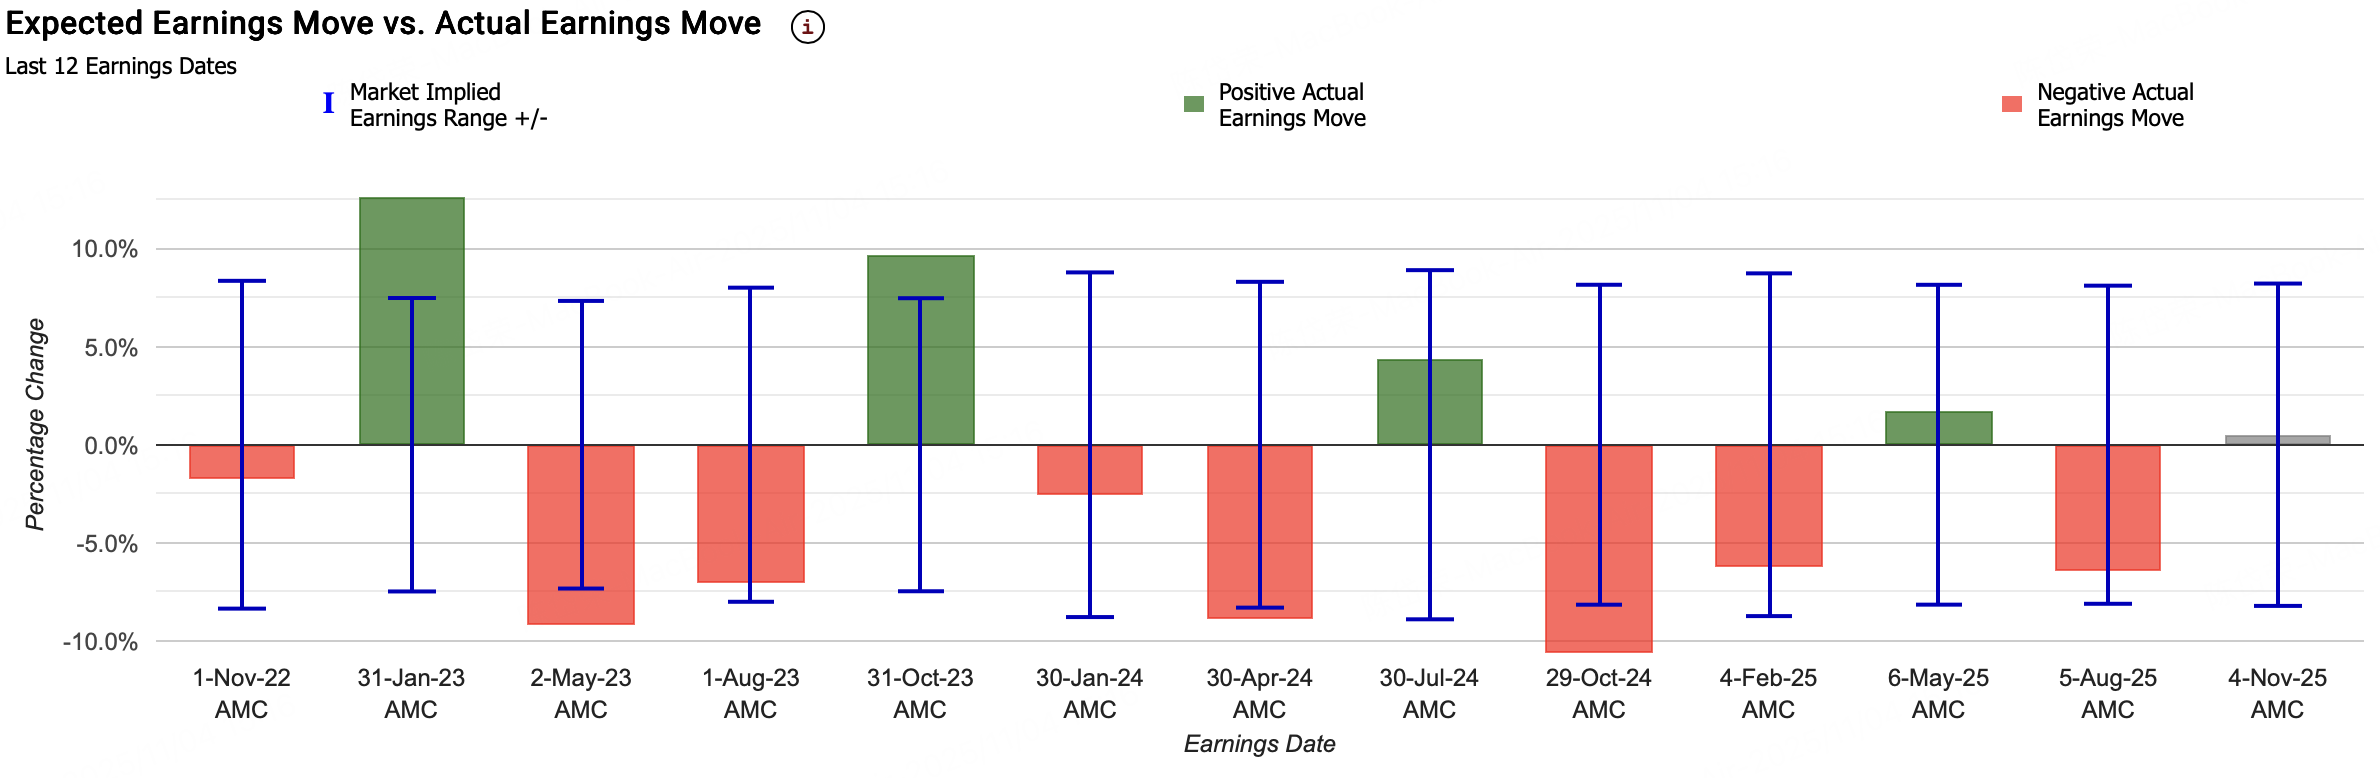
AMD's current implied volatility IV is 8.2%, which means that the market is betting that its stock price will fluctuate by 8.2% after the release of its earnings report, while AMD's average stock price fluctuation in the past four earnings days is 6.3%.
In the past 12 quarters, the options market has58%Time ofOverestimateThe stock price fluctuation range after AMD's financial report. On average,The market originally expected the stock price to fluctuate about ± 8. 1% after the earnings release, but the actual average fluctuation (absolute value calculation) is only6.8%。
The actual stock price movements for AMD over the last six earnings dates were:-8.9%, +4.4%,-10.6%,-6.3%, +1.8%,-6.4%.
For this AMD financial report transaction, we adopt the strategy of selling iron eagle.
Sell Iron Eagle Strategy
1. Review of strategic structure
Buy Put 225P@1.08
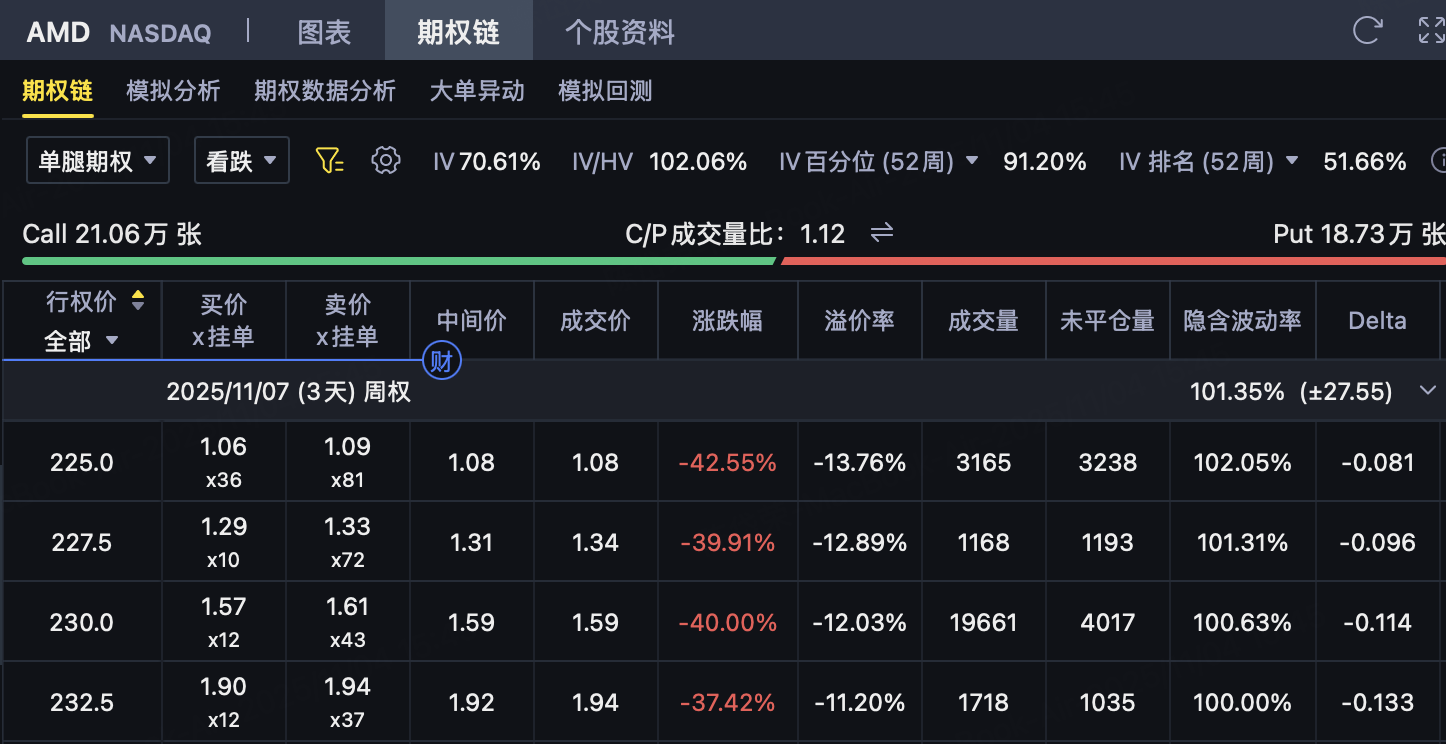
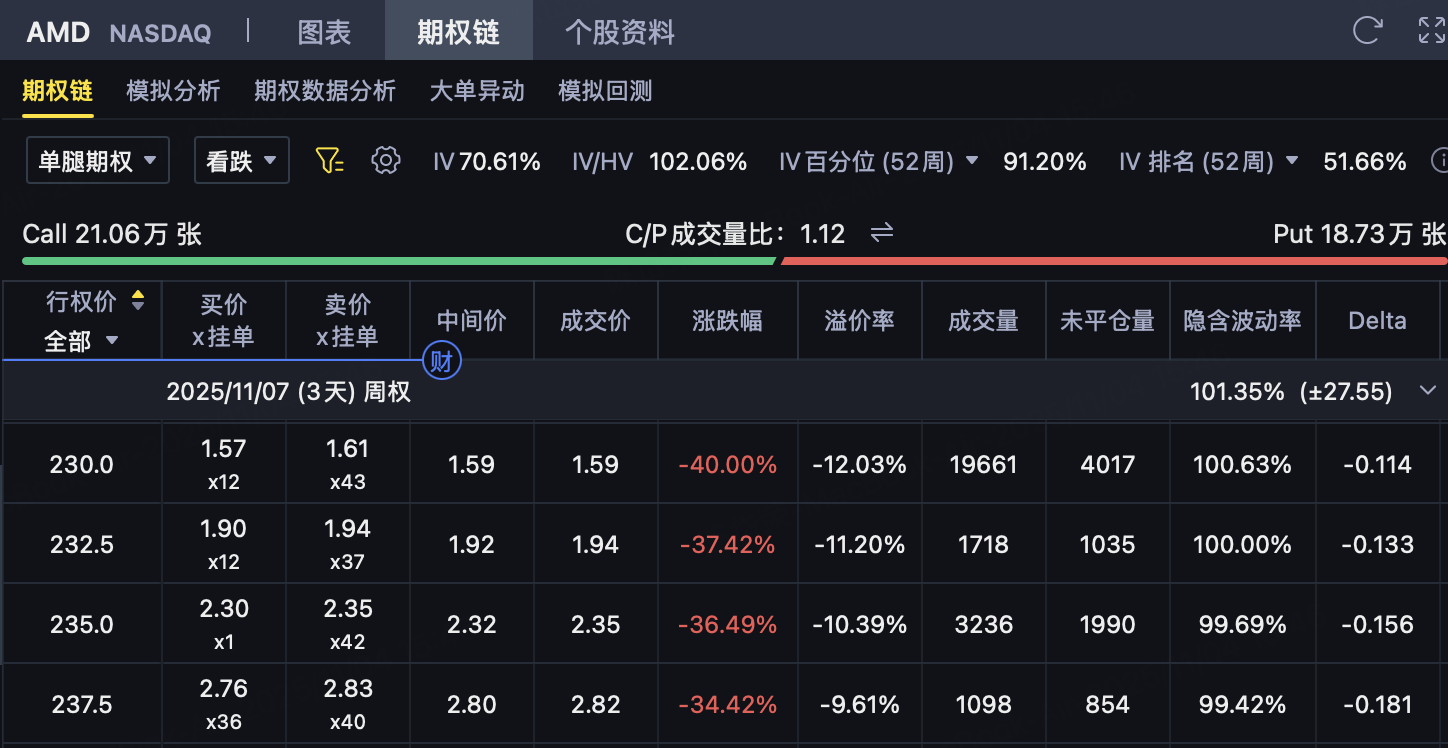
SELL PUT 230P@1.59
SELL CALL 260C@10.6

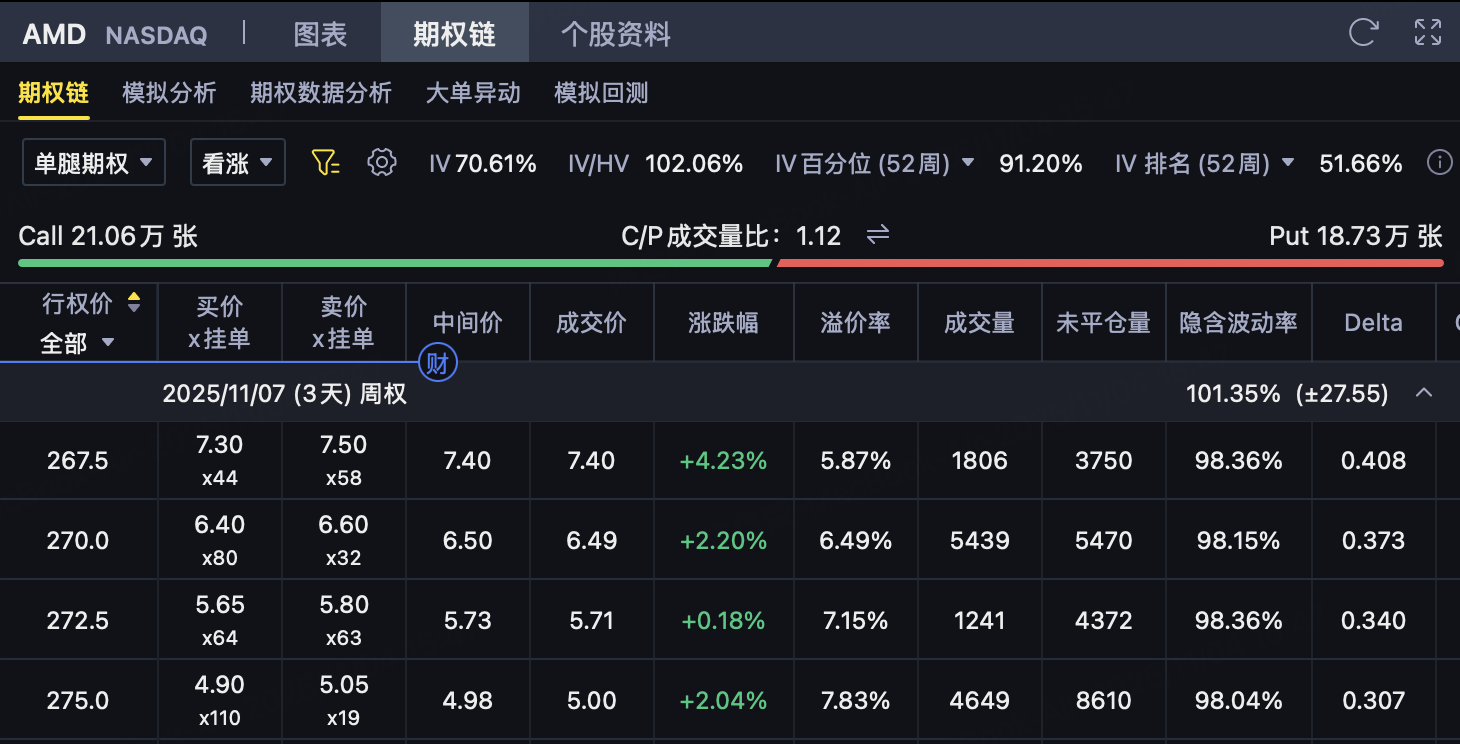
Buy Bullish 267.5 C@7.4
Net premium:
1.59+10.6−1.08−7.4=3.711.59+10.6−1.08−7.4=3.71
Initial net income =$3.71/Share(i.e. $371/contract)
2. Break-even point analysis
Maximum profit rangeWhen the stock price is between 230 and 260, all options expire out of the money and all premium are retained.Maximum profit = $3.71/share ($371/contract)
Downside loss range (stock price < 225)
The difference between the Put 230 and 225 is $5
Loss = 5 − 3. 71 = $1.29/shareMaximum downside loss = $1.29/share (i.e. $129/contract)
Upward loss range (stock price > 267.5)
Call 260 vs. 267.5 $7.5
Loss = 7.5 − 3.71 = $3.79/shareMaximum upside loss = $3.79/share (i.e. $379/contract)
Break-even point
Lower equilibrium point: 230 − 3. 71 =226.29
Upper balance point: 260 + 3.71 =263.71
Breakeven range:226.29 ~ 263.71
3. Risk analysis
Directionality and expectation
< ol start = "1" style = "" >
This is still a typicalNeutral strategy, betting that AMD's stock price will remain in the 230 ~ 260 range after the financial report.
If the volatility is less than market expectations, the time value decay (theta) is beneficial to investors.
Risk asymmetry
The upper protective spacing narrowed to $7.50, while the lower spacing was $5.
HenceMore risky upside(Maximum loss $3.79 vs. downside $1.29).
Once the extremely positive financial report causes AMD to skyrocket above 267.5, the loss will be more significant.
Volatility impact
Because it is a net option selling strategy,Volatility drop (IV drop) favorable, if the implied volatility falls back after the financial report, investors will benefit from the contraction of time value.
If the market is too nervous before the earnings report and the IV rises, investors' floating losses may expand.
Time decay (Theta) effect
Time is in the investor's favor, as long as the price stabilizes within the range, profits gradually lock in as expiration approaches.
However, it is necessary to be careful that the sudden increase in volatility near the earnings date will lead to a breakthrough range.
Summary of profit and loss profile
Maximum profit:$3.71/share, when the stock price expires between 230-260.
Maximum loss:Down $1.29/Upside $3.79.
Break-even point:226.29 – 263.71。
Risk bias:Upward direction.
Disclaimer: Investing carries risk. This is not financial advice. The above content should not be regarded as an offer, recommendation, or solicitation on acquiring or disposing of any financial products, any associated discussions, comments, or posts by author or other users should not be considered as such either. It is solely for general information purpose only, which does not consider your own investment objectives, financial situations or needs. TTM assumes no responsibility or warranty for the accuracy and completeness of the information, investors should do their own research and may seek professional advice before investing.
