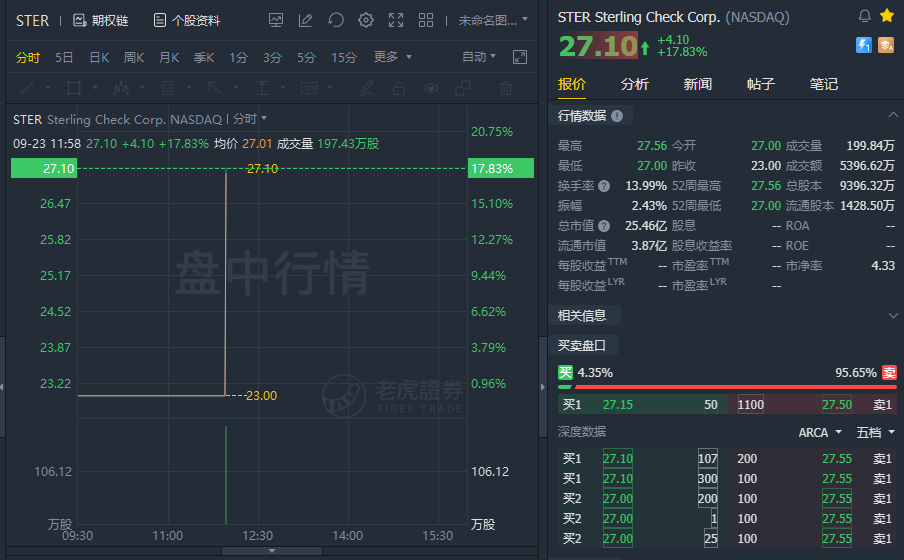
(Sept 23) Sterling Check Corp. opens for trading at $27.1, up about 18% from IPO price.
New York-based Sterling was founded to develop a full suite of background screening, verifications and ongoing monitoring services for businesses.
Management is headed by Chief Executive Officer Joshua Peirez, who has been with the firm since July 2018 and was previously president and COO of Dun & Bradstreet and held senior roles at Mastercard prior to that.
The company’s primary offering categories include:
Identity verification
Background screening
Credential verifications
Onboarding
Ongoing monitoring
Sterling has received at least $775 million in equity investment from investors including Goldman Sachs and The Greenblatt Trusts.
Customer Acquisition
The firm pursues large clients through a direct sales team approach organized by industry vertical and region.
For the 12 months ended June 30, 2021, the firm's platform performed over 75 million searches for over 40,000 clients.
Selling, G&A expenses as a percentage of total revenue have dropped as revenues have fluctuated, as the figures below indicate:
Selling, G&A |
Expenses vs. Revenue |
Period |
Percentage |
Six Mos. Ended June 30, 2021 |
22.8% |
2020 |
27.0% |
2019 |
29.6% |
(Source)
The Selling, G&A efficiency rate, defined as how many dollars of additional new revenue are generated by each dollar of Selling, G&A spend, rebounded to 1.3x in the most recent reporting period, as shown in the table below:
Selling, G&A |
Efficiency Rate |
Period |
Multiple |
Six Mos. Ended June 30, 2021 |
1.3 |
2020 |
-0.4 |
(Source)
The Rule of 40 is a software industry rule of thumb that says that as long as the combined revenue growth rate and EBITDA percentage rate equal or exceed 40%, the firm is on an acceptable growth/EBITDA trajectory.
STER’s most recent calculation was 51% for the six months ended June 30, 2021, so the firm has performed well in this regard, per the table below:
Rule of 40 |
Calculation |
Recent Rev. Growth % |
44% |
EBITDA % |
8% |
Total |
51% |
(Source)
Market & Competition
According to a 2021 marketresearch reportby The Insight Partners, the global employment screening market, one of the firm's focus areas, was an estimated $4.2 billion in 2020 and is forecast to reach $6.4 billion by 2028.
This represents a forecast CAGR of 5.5% from 2021 to 2028.
The main drivers for this expected growth are increased populations in urban areas resulting in greater job opportunities and employee demand and a growing incidence of application fraud or inflation.
Also, the number of applicants for each job opening has increased along with a larger number of contract, temporary and 'gig economy' workers.
Major competitive or other industry participants include:
First Advantage
HireRight
Accurate Background
ADP
Cisive
Checkr
DISA
Triton
Other smaller players
Financial Performance
Sterling’s recent financial results can be summarized as follows:
Rebounding topline revenue growth
Variable gross profit growth
Slightly reduced gross margin
A swing to operating profit and net income
Growing cash flow from operations in 2021
Below are relevant financial results derived from the firm’s registration statement:
Total Revenue |
||
Period |
Total Revenue |
% Variance vs. Prior |
Six Mos. Ended June 30, 2021 |
$ 298,698,000 |
43.6% |
2020 |
$ 454,053,000 |
-8.7% |
2019 |
$ 497,116,000 |
|
Gross Profit (Loss) |
||
Period |
Gross Profit (Loss) |
% Variance vs. Prior |
Six Mos. Ended June 30, 2021 |
$ 155,539,000 |
41.9% |
2020 |
$ 236,743,000 |
-14.2% |
2019 |
$ 275,769,000 |
|
Gross Margin |
||
Period |
Gross Margin |
|
Six Mos. Ended June 30, 2021 |
52.07% |
|
2020 |
52.14% |
|
2019 |
55.47% |
|
Operating Profit (Loss) |
||
Period |
Operating Profit (Loss) |
Operating Margin |
Six Mos. Ended June 30, 2021 |
$ 23,204,000 |
7.8% |
2020 |
$ (23,103,000) |
-5.1% |
2019 |
$ (13,374,000) |
-2.7% |
Net Income (Loss) |
||
Period |
Net Income (Loss) |
|
Six Mos. Ended June 30, 2021 |
$ 4,025,000 |
|
2020 |
$ (52,293,000) |
|
2019 |
$ (46,682,000) |
|
Cash Flow From Operations |
||
Period |
Cash Flow From Operations |
|
Six Mos. Ended June 30, 2021 |
$ 45,290,000 |
|
2020 |
$ 36,185,000 |
|
2019 |
$ 36,204,000 |
|
(Glossary Of Terms) |
(Source)
As of June 30, 2021, Sterling had $94.3 million in cash and $744.8 million in total liabilities.
Free cash flow during the twelve months ended June 30, 2021, was $45 million.
IPO Details
STER intends to sell 4.76 million shares and selling shareholders will offer 9.525 million shares of common stock at a proposed midpoint price of $21.00 per share for gross proceeds of approximately $300 million, not including the sale of customary underwriter options.
No existing shareholders have indicated an interest to purchase shares at the IPO price.
Assuming a successful IPO at the midpoint of the proposed price range, the company’s enterprise value at IPO (ex- underwriter options) would approximate $2.4 billion.
Excluding effects of underwriter options and private placement shares or restricted stock, if any, the float to outstanding shares ratio will be approximately 15.2%. A figure under 10% is generally considered a ‘low float’ stock which can be subject to significant price volatility.
Per the firm’s most recent regulatory filing, it plans to use the net proceeds as follows:
We currently intend to use the net proceeds to us from this offering, together with cash on hand, to repay approximately $100.0 million outstanding under our Term loan. We intend to use the remainder, if any, of the net proceeds to us from this offering for general corporate purposes.
Management’s presentation of the company roadshow isavailable here.
Regarding outstanding legal proceedings, management said the firm is not a party to any legal proceedings that it believes would be material to its operations or financial condition.
Listed bookrunners of the IPO are Goldman Sachs, J.P. Morgan, Morgan Stanley and other investment banks.
Valuation Metrics
Below is a table of the firm’s relevant capitalization and valuation metrics at IPO, excluding the effects of underwriter options:
Measure [TTM] |
Amount |
Market Capitalization at IPO |
$1,973,227,914 |
Enterprise Value |
$2,401,254,914 |
Price / Sales |
3.62 |
EV / Revenue |
4.41 |
EV / EBITDA |
122.06 |
Earnings Per Share |
-$0.08 |
Float To Outstanding Shares Ratio |
15.20% |
Proposed IPO Midpoint Price per Share |
$21.00 |
Net Free Cash Flow |
$44,998,000 |
Free Cash Flow Yield Per Share |
2.28% |
Revenue Growth Rate |
43.64% |
(Glossary Of Terms) |
(Source)
As a reference, a potential public comparable would be First Advantage(NASDAQ:FA); shown below is a comparison of their primary valuation metrics:
Metric |
First Advantage |
Sterling Check |
Variance |
Price / Sales |
5.76 |
3.62 |
-37.1% |
EV / Revenue |
6.53 |
4.41 |
-32.5% |
EV / EBITDA |
23.41 |
122.06 |
421.4% |
Earnings Per Share |
$0.04 |
-$0.08 |
-293.0% |
Revenue Growth Rate |
19.2% |
43.64% |
127.89% |
(Glossary Of Terms) |
(S-1/AandSeeking Alpha)
Commentary
STER is going public to obtain investment to pay down some of its debt and for its corporate expansion initiatives.
The firm’s financials show rebounding topline revenue growth, uneven gross profit growth, a swing to operating profit and net income and growing cash flow from operations in 2021.
Free cash flow for the twelve months ended June 30, 2021, was an impressive $45 million.
Selling, G&A expenses as a percentage of total revenue have trended lower as revenue has varied and its Selling, G&A efficiency rate rebounded to 1.3x in the most recent six-month reporting period.
The market opportunity for providing background checks and related services is large and expected to grow at a moderate CAGR Of 5.5% in the coming years, although the continued transition to a decentralized workforce may increase demand a bit above this estimate.
Goldman Sachs is the lead left underwriter and IPOs led by the firm over the last 12-month period have generated an average return of 37.3% since their IPO. This is a mid-tier performance for all major underwriters during the period.
The general business cycle - when companies hire fewer workers during down economic periods, demand for the company’s services will decline.
While Sterling is not immune to the ups and downs of the business cycle and potential future pandemic variant effects on economic activity, the firm has rebounded impressively and appears positioned to compete in a growing market.
As for valuation, compared to First Advantage, which went public earlier in 2021 and performed since its debut, STER appears reasonably valued on a revenue multiple basis as the firm is growing revenue at a faster rate. STER is nearing EPS breakeven.
Given the company’s strong rebound after the 2020 pandemic period and reasonable IPO valuation, the IPO is worth a close look.
Comments