Technical Analysis of FTSE ST REIT Index (FSTAS8670)
At the point of writing, the chart of FSTAS8670 is not available on multiple charting platforms. However I am able to find another ticker (FSTRE2000) fromMarketWatch.
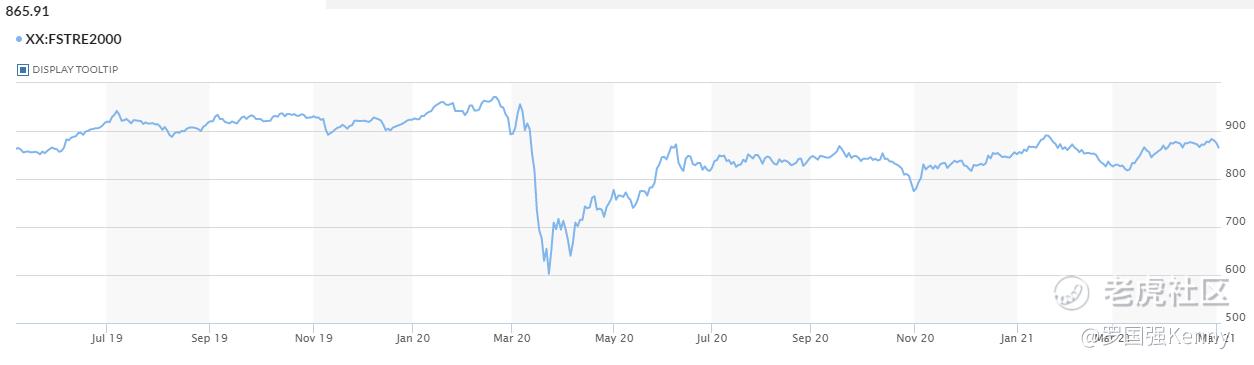
FTSE ST Real Estate Investment Trusts (FTSE ST REIT Index) increased slightly from 859.68 to 865.91 (+0.72%) compared tolast month update. Currently the Singapore REIT index is still trading with a range between 816 and 874.
- As for now, Short term direction: Sideway.
- Immediate Support at 816, followed by 775.
- Immediate Resistance at 874.
Previous chart on FTSE ST REIT index can be found in the last post:Singapore REIT Fundamental Comparison Tableon April 5, 2021.
Fundamental Analysis of 40 Singapore REITs
The following is the compilation of 40 Singapore REITs with colour coding of the Distribution Yield, Gearing Ratio and Price to NAV Ratio.
- Note 1: The Financial Ratio are based on past data and there are lagging indicators.
- Note 2: This REIT table takes into account the dividend cuts due to the ** outbreak. Yield is calculated trailing twelve months (ttm), therefore REITs with delayed payouts might have lower displayed yields, thus yield displayed might be lower.
- Note 3: REITs highlighted in blue have been updated with the latest Q1 2021 business updates.
(Source: https://stocks.cafe/kenny/advanced)
Dosign upfor the REIT screener at only ~$8.33 per month! (limited time only). Normal price $120 per year.
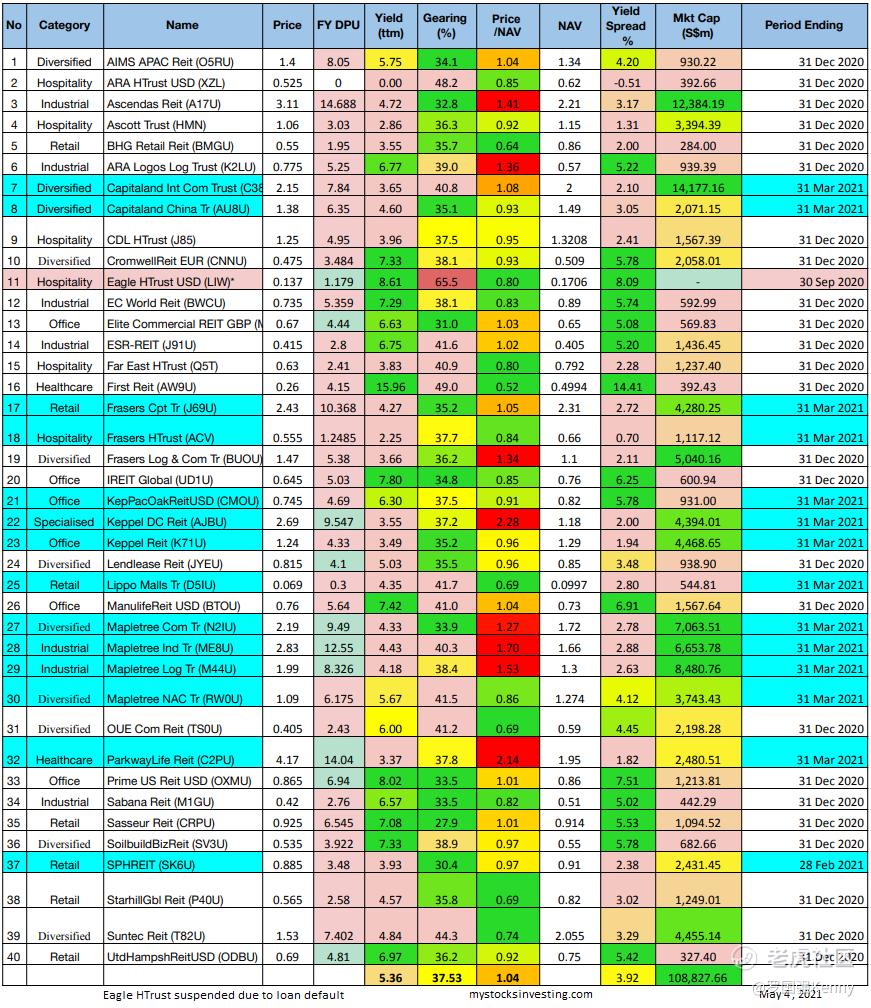
Price/NAV increased at 1.04
- Was 1.01 in April 2021.
- Singapore Overall REIT sector is at about fair value now.
- Take note that NAV is adjusted downward for most REITs due to drop in rental income (Property valuation is done using DCF model or comparative model)
TTM Distribution Yield decreased to 5.36%
- Decreased from 5.47% in April 2021.
- 23% of Singapore REITs (9 out of 39) have distribution yields of above 7%.
- Do take note that these yield numbers are based on current prices taking into account the delayed distribution/dividend cuts due to **, and post circuit breaker recovery.
- Excluded Eagle Hospitality Trust due to suspension.
Gearing Ratio at 37.53%.
- Remained almost the same at 37.44% in April 2021.
- Gearing Ratios are updated quarterly.
- In general, Singapore REITs sector gearing ratio is healthy but started to increase due to the reduction of the valuation of portfolios and increase in borrowing due to Covid-19.
Most overvalued REITs (based on Price/NAV)
- Keppel DC REIT (Price/NAV = 2.28)
- Parkway Life REIT (Price/NAV = 2.14)
- Mapletree Industrial Trust (Price/NAV = 1.70)
- Mapletree Logistics Trust (Price/NAV = 1.53)
- Ascendas REIT (Price/NAV = 1.41)
- No change from January – April 2021 for top 5 overvalued REITs ranking
Most undervalued REITs (based on Price/NAV)
- First REIT (Price/NAV = 0.52)
- BHG REIT (Price/NAV = 0.64)
- OUE Commercial REIT (Price/NAV = 0.69)
- Starhill Global REIT (Price/NAV = 0.69)
- Lippo Malls Indonesia Retail Trust (Price/NAV = 0.69)
- Suntec REIT (Price/NAV = 0.74)
- All 6 REITs were also the top 6 undervalued REITs of April 2021
Highest Distribution Yield REITs (ttm)
- First REIT (15.96%)
- Prime US REIT (8.02%)
- IREIT Global (7.80%)
- Manulife REIT (7.42%)
- Cromwell European REIT (7.33%)
- Soilbuild Business Space REIT (7.33%)
- Reminder that these yield numbers are based on current prices taking into account delayed distribution/dividend cuts due to **.
- Some REITs opted for semi-annual reporting and thus no quarterly DPU was announced.
Highest Gearing Ratio REITs
- Eagle Hospitality Trust (65.5%) * Filed for Chapter 11 Bankruptcy Protection *
- First REIT (49%)
- ARA Hospitality Trust (48.2%)
- Suntec REIT (44.3%)
- Lippo Malls Retail Trust (41.7%)
- ESR REIT (41.6%)
- Mapletree NAC Trust (41.3%)
- OUE Commercial REIT (41.2%)
Total Singapore REIT Market Capitalisation = S$108.8 Billion.
- Increased from S$107.9 Billion in January 2021.
Biggest Market Capitalisation REITs:
- Capitaland Integrated Commercial Trust ($14.18B)
- Ascendas REIT ($12.38B)
- Mapletree Logistics Trust ($8.48B)
- Mapletree Commercial Trust ($7.06B)
- Mapletree Industrial Trust ($6.65B)
- No change in ranking compared to March and April 2021 update.
Smallest Market Capitalisation REITs:
- BHG Retail REIT ($284M)
- United Hamsphire REIT ($327M)
- First REIT ($392M)
- ARA Hospitality Trust ($393M)
- Sabana REIT ($442M)
- No change in ranking compared to March and April 2021 update.
- Eagle Hospitality Trust is currently suspended
Disclaimer: The above table is best used for “screening and shortlisting only”. It is NOT for investing (Buy / Sell) decision. To learn how to use the table and make appropriate investment decisions, sign up for the nextREIT Investing Workshophere to learn how to choose fundamentally strong Singapore REITs for long-term investing and passive income generation.
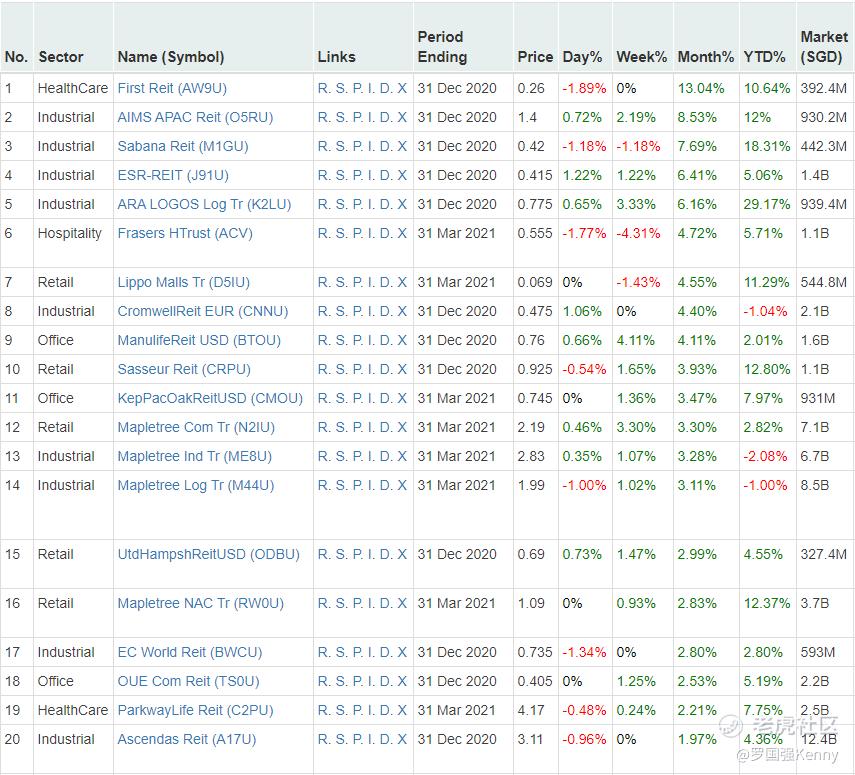
Top 20 Performers of the Month
(Source: https://stocks.cafe/kenny/advanced)
SG 10 Year & US 10 Year Government Bond Yield
- SG 10 Year: 1.551%
- US 10 Year: 1.584%

Summary
Fundamentally the whole Singapore REITs is slightly overvalued now based on the average Price/NAV value of the S-REITs. Below is the market cap heat map for the past 1 month.
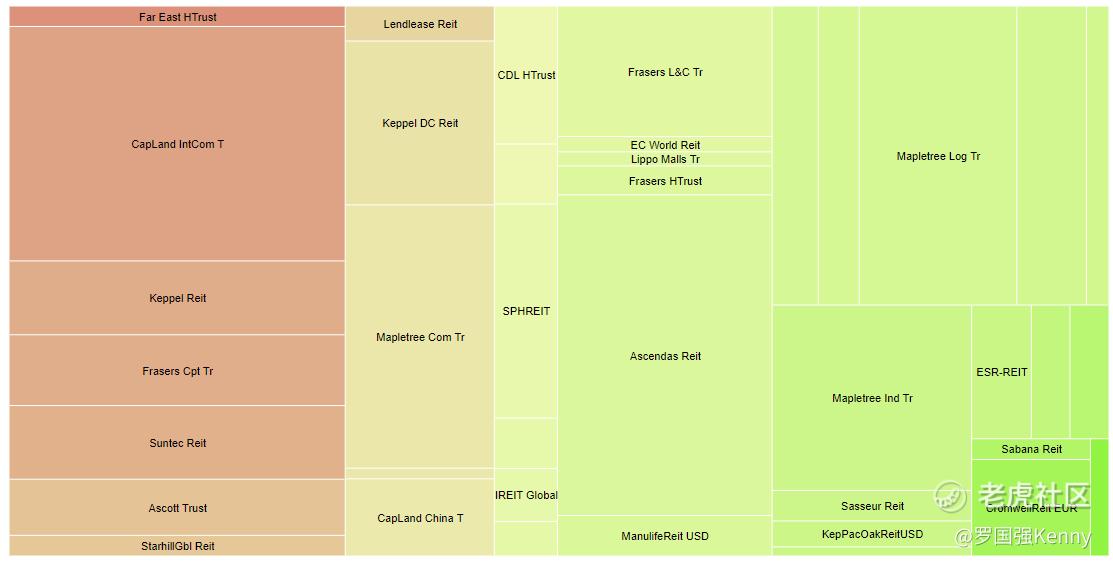
(Source: https://stocks.cafe/kenny/overview)
Partially due to the spike in Covid-19’s community cases in Singapore in the past week, there has been a knee-jerk sell-off in Singapore Retail and Office REITs, as theSingapore government tightens Covid-19 measures and moves back into Phase 2w.e.f May 8.
Yield spread (in reference to 10 year Singapore government bond of 1.551%) continues to tighten from 4.08% to 3.809%. However, the risk premium is still attractive to accumulate Singapore REITs in stages to lock in the current price and to benefit from long-term yield after the recovery. Moving forward, it is expected that DPU will increase due to the recovery of global economy.
Technically the REIT Index is still trading in a sideways consolidation waiting for a breakout (upside bias). Current macro factors such as a low-interest rate environment, aggressive M&A for future DPU growth, and recovery of global economic support the bullish breakout.
Note: This above analysis is for my own personal research and it is NOT a buy or sell recommendation. Investors who would like to leverage my extensive researchand years of Singapore REIT investing experience can approach me separately for a REIT Portfolio Consultation.
I have been invited as one of the panelists of the upcomingREITs Symposium 2021event to share about “The Megatrends Impacting S-REITs” on May 22, 2021. You can check the rest of theprogram of REITs Symposiumhere.

Sign up here:https://rebrand.ly/REITs_MSI
Kenny Loh is a Senior Consultantand REITs Specialist of Singapore’s top Independent Financial Advisor. He helps clients construct diversified portfolios consisting of different asset classes from REITs, Equities, Bonds, ETFs, Unit Trusts, Private Equity, Alternative Investments, Digital Assets and Fixed Maturity Funds to achieve an optimal risk adjusted return. Kenny is also a CERTIFIED FINANCIAL PLANNER, SGX Academy REIT Trainer, Certified IBF Trainer of Associate REIT Investment Advisor (ARIA) and also invited speaker of REITs Symposium and Invest Fair. You can join my Telegram channel #REITirement – SREIT Singapore REIT Market Update and Retirement related news. https://t.me/REITirement
Comments