Technical Analysis -- Episode 3: Evening Star(Click here to learn)
Three Black Crows is a technical pattern consisting of three consecutive declining candlesticks in a row. This pattern is generally considered a bearish signal indicating that stock prices may continue to fall.
In short, "Three Black Crows" is a more obvious bearish pattern.
It consists of three consecutive candlesticks with red bodies, indicating a downward trend in stock prices. The closing prices of these three candlesticks are all lower than the previous day's closing price, indicating an increase in selling pressure.
The appearance of "Three Black Crows" indicates a change in market sentiment, and investors generally believe that stock prices will continue to fall, leading to possible selling behaviour.
Generally, "Three Black Crows" has the following characteristics on the technical chart:
Three long black candlesticks: "Three Black Crows" usually consists of three long black candlesticks, and each candlestick's closing price is lower than the previous candlestick's closing price.
Different trading volumes: The trading volume of the three candlesticks in "Three Black Crows" usually increases gradually, indicating that more market participants are becoming bearish.
Stable formation structure: The three candlesticks in "Three Black Crows" should have a similar formation, all long black candlesticks.
Appears in an uptrend: "Three Black Crows" usually appears after the asset's price, such as a stock, has risen, indicating a clear change in market sentiment.
In summary, "Three Black Crows" has very obvious downward trend characteristics.
Here is an example to help you better understand "Three Black Crows":
1.Amazon (AMZN):
On April 20, 2022, after a period of turbulence, Amazon showed the "Three Black Crows" technical pattern, and the overall trading volume increased, indicating an increase in bearish strength and possible weakness in the future. Afterwards, Amazon's stock price showed a clear downward trend.
2.NVIDIA (NVDA):
On October 7, 2018, after a slight shake, NVIDIA showed the "Three Black Crows" technical pattern, and the trading volume continued to increase, indicating a gradual increase in bearish strength and possible weakness in the future. Afterwards, NVIDIA's stock price showed a clear downward trend.
Regarding the "Three Black Crows" technical pattern, you need to pay attention to the following points:
Do not make trading decisions based solely on one technical pattern: The "Three Black Crows" technical pattern is only one indicator in technical analysis and cannot be the only decision-making basis for buying and selling stocks. You need to analyse it comprehensively with other technical indicators and the fundamentals of the stock.
Pay attention to the position of the "Three Black Crows" pattern: If the "Three Black Crows" appears after the stock price has risen, it may indicate that the price will start to fall. However, if the "Three Black Crows" appears after the price has fallen, it may only be a temporary adjustment in price.
For example, on July 16, 2021, NVIDIA showed the "Three Black Crows" technical pattern, but after the selling pressure weakened, NVIDIA continued to rise.
That's all about the knowledge of the Three Black Crows technical pattern! We welcome you to join the activity and win prizes!
【Reply to Win Rewards】
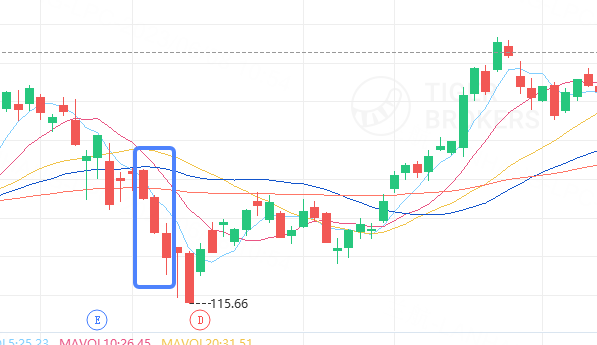
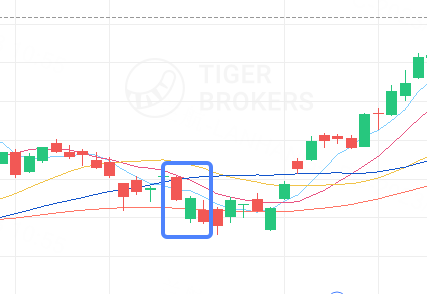
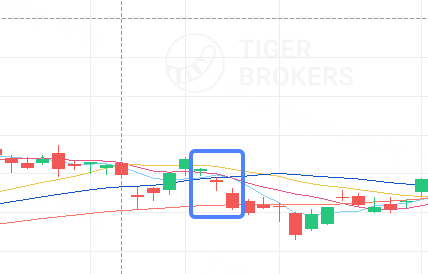
Tigers who select the right chart pattern of the Three Black Crows from the following three figures will receive 5 Tiger Coins. (Please comment on the stock or the photo directly)


Tigers who share stocks of chart out of the following options will be rewarded with 10 Tiger Coins.
【Event Duration】
8 June 2023--15 June 2023
In the next issue, we'll introduce another useful technical pattern, Three White Soldiers, which will make your stock trading easier and simpler after you learn it!
 Reward 1000 Tiger-coins
Comments