A Almost hedge Portfolio?
The trends of $Tesla Motors(TSLA)$ and $NVIDIA Corp(NVDA)$ have been opposite as the stock price chart shows.
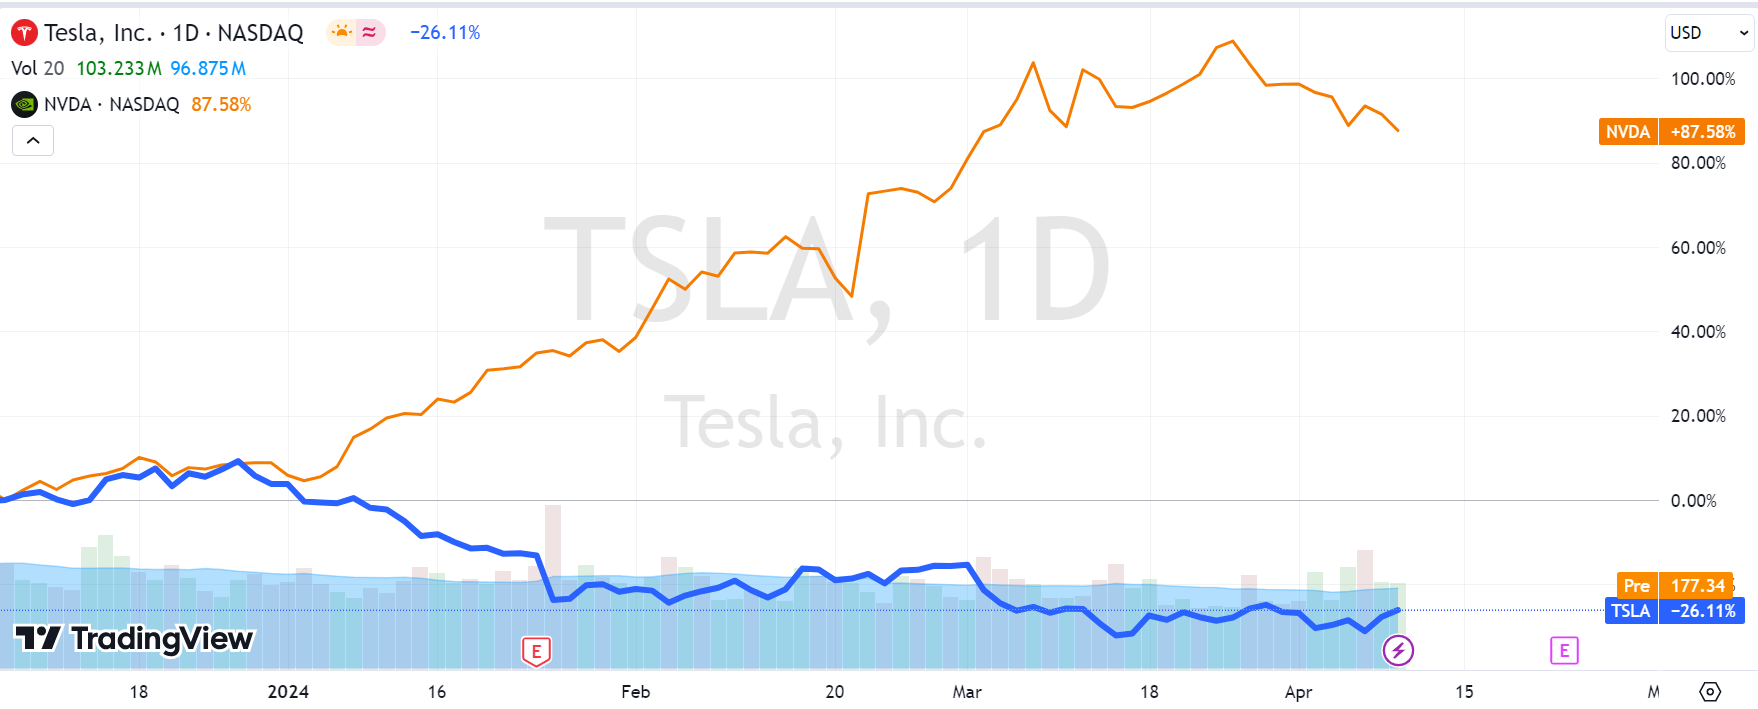
About price
In the first three months, NVDA had unlimited glory, while Tesla shareholders suffered.
In April, Tesla instead rose against the trnd.
The correlation of NVDA and Tesla YTD is only 0.002, compared to an average of 0.245 over the past two years.
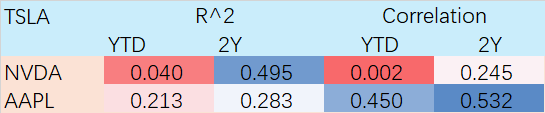
Similarly, the correlation between Tesla and $Apple(AAPL)$ remains around 0.5.
About Volatility
Turn to options' implied volatility, since 2024, the at-the-money options volatility of Tesla and NVDA has also shown fluctuation of one doing well while the other drops.
Both PUT and CALL, NVDA's IV has experienced a situation similar to stock price volatility.

The decline since the high point in March is also quite noticeable. Currently, the at-the-money options IV levels of NVDA and Tesla are once again similar.
Comments