TL;DR: The uptrend is likely to end within November, with a chance of further upside but expecting a 2-day pullback. Key focus on the November 29th $435 calls ($TSLA 20241129 435.0 CALL$ ).
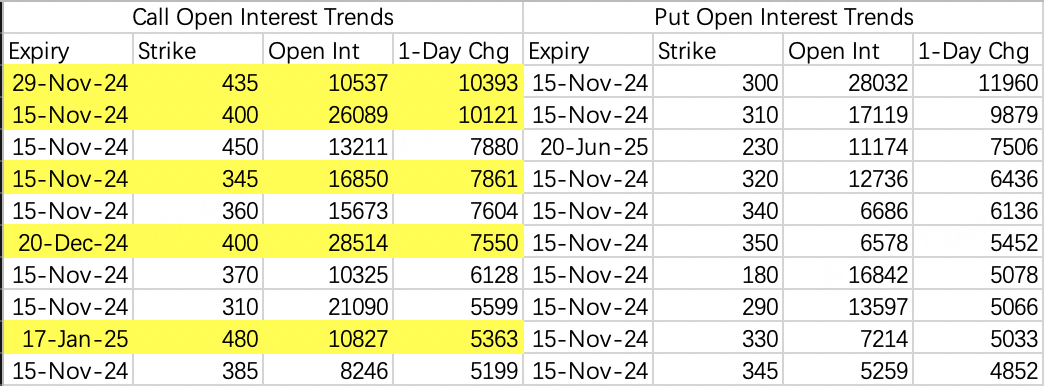
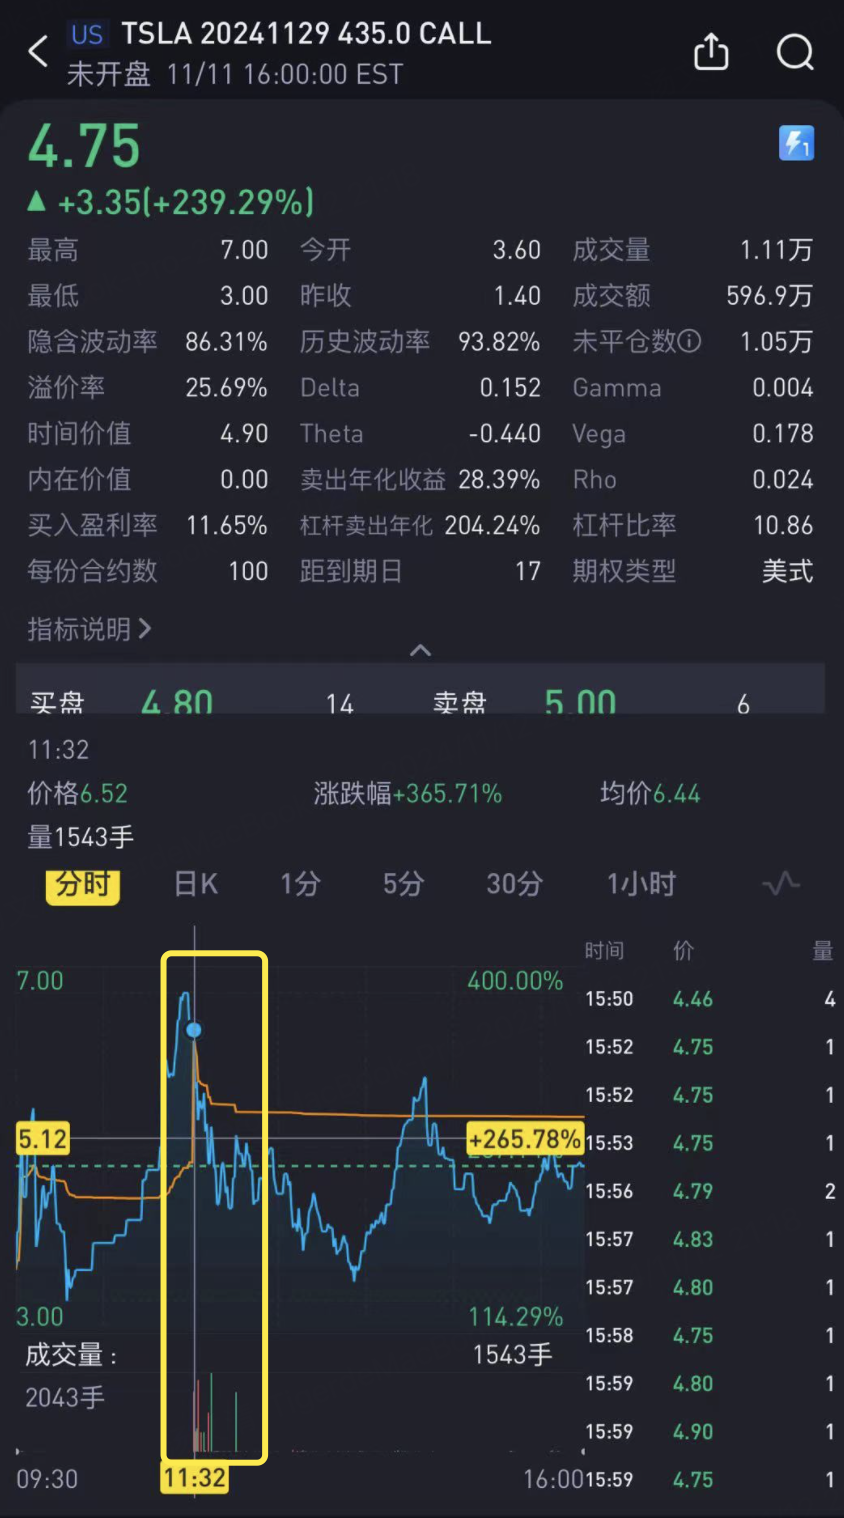
Monday's option flows in TSLA were noteworthy, with the highest opening interest in the $435 November 29th calls ($TSLA 20241129 435.0 CALL$ ).
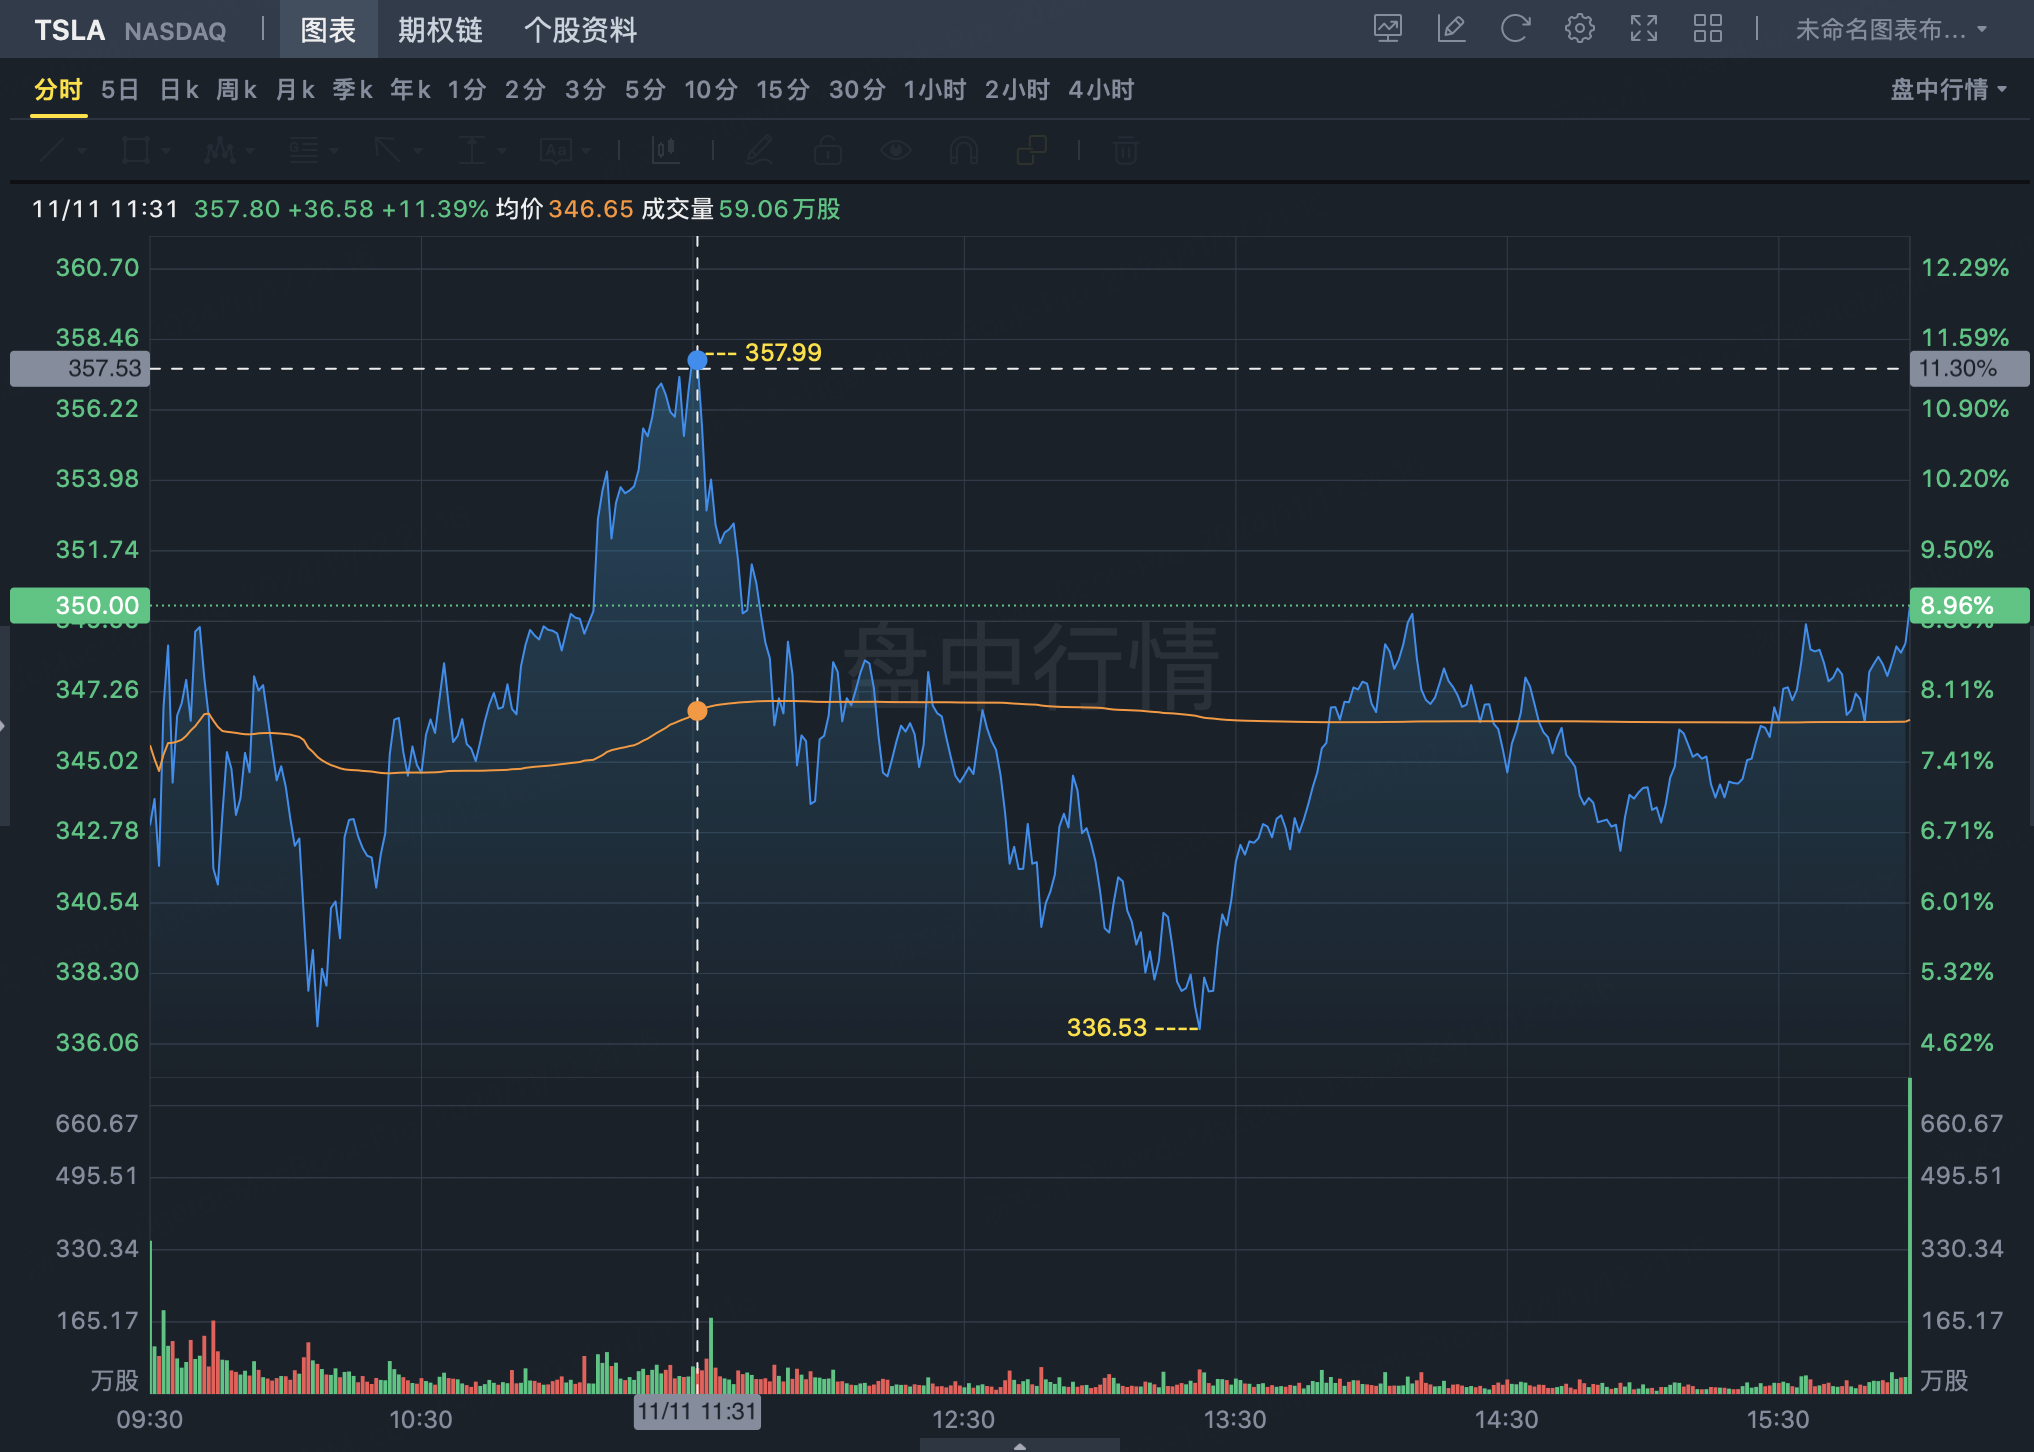
The timing was interesting, with most of the action occurring right at 11:30am ET.
At that time, TSLA spiked to $358 intraday, tagging the upper bounds of the intermediate-term uptrend channel before pulling back.
The $435 strikes were not outright bullish buying, but rather a roll from a lower strike. While the rolling activity didn't print as a combined order, analyzing the trade data reveals around 11,000 contracts traded:
Close $TSLA 20241115 345.0 CALL$
Roll and Buy $TSLA 20241129 435.0 CALL$
The $345 calls closed out were initially purchased this past Friday 11/8, but dispersed in smaller fillers which avoided setting off my single print filters until yesterday's rolling activity.
The significance is this retail whale bought the $345 calls on Friday expecting further upside this week. But upon seeing TSLA tag resistance and pull back, they opted to roll that exposure out to the November 29th $435 calls ($TSLA 20241129 435.0 CALL$ ).
While $435 seems exciting, I think the November 29th expiration is more notable than the strike itself.
Given this trader's typical approach, if they expected an immediate bounce, they likely would have rolled to weekly calls instead of extending out to late November expirations. This suggests they anticipate some consolidation over the next 2-3 days.
There is a chance TSLA rips higher, but the patterns imply this run could be exhausting within this calendar month. If we don't see further upside by late November, this vertical move is likely over - similar to the rolling call buying we saw during the China rally unwind.
Ultimately, this is still a momentum trade, closing the $345 calls for $18 and re-opening the $435s for $6.50 - they're not risking new capital on the move.
Interestingly, as this trader closed their soon-to-expire $345 calls, another buyer emerged taking down 9,317 contracts of those same $345 strikes ($TSLA 20241115 345.0 CALL$ ) for $16.58 million in premium - a direct opposing view on very short-dated upside.
$SPY ETF (SPY)$
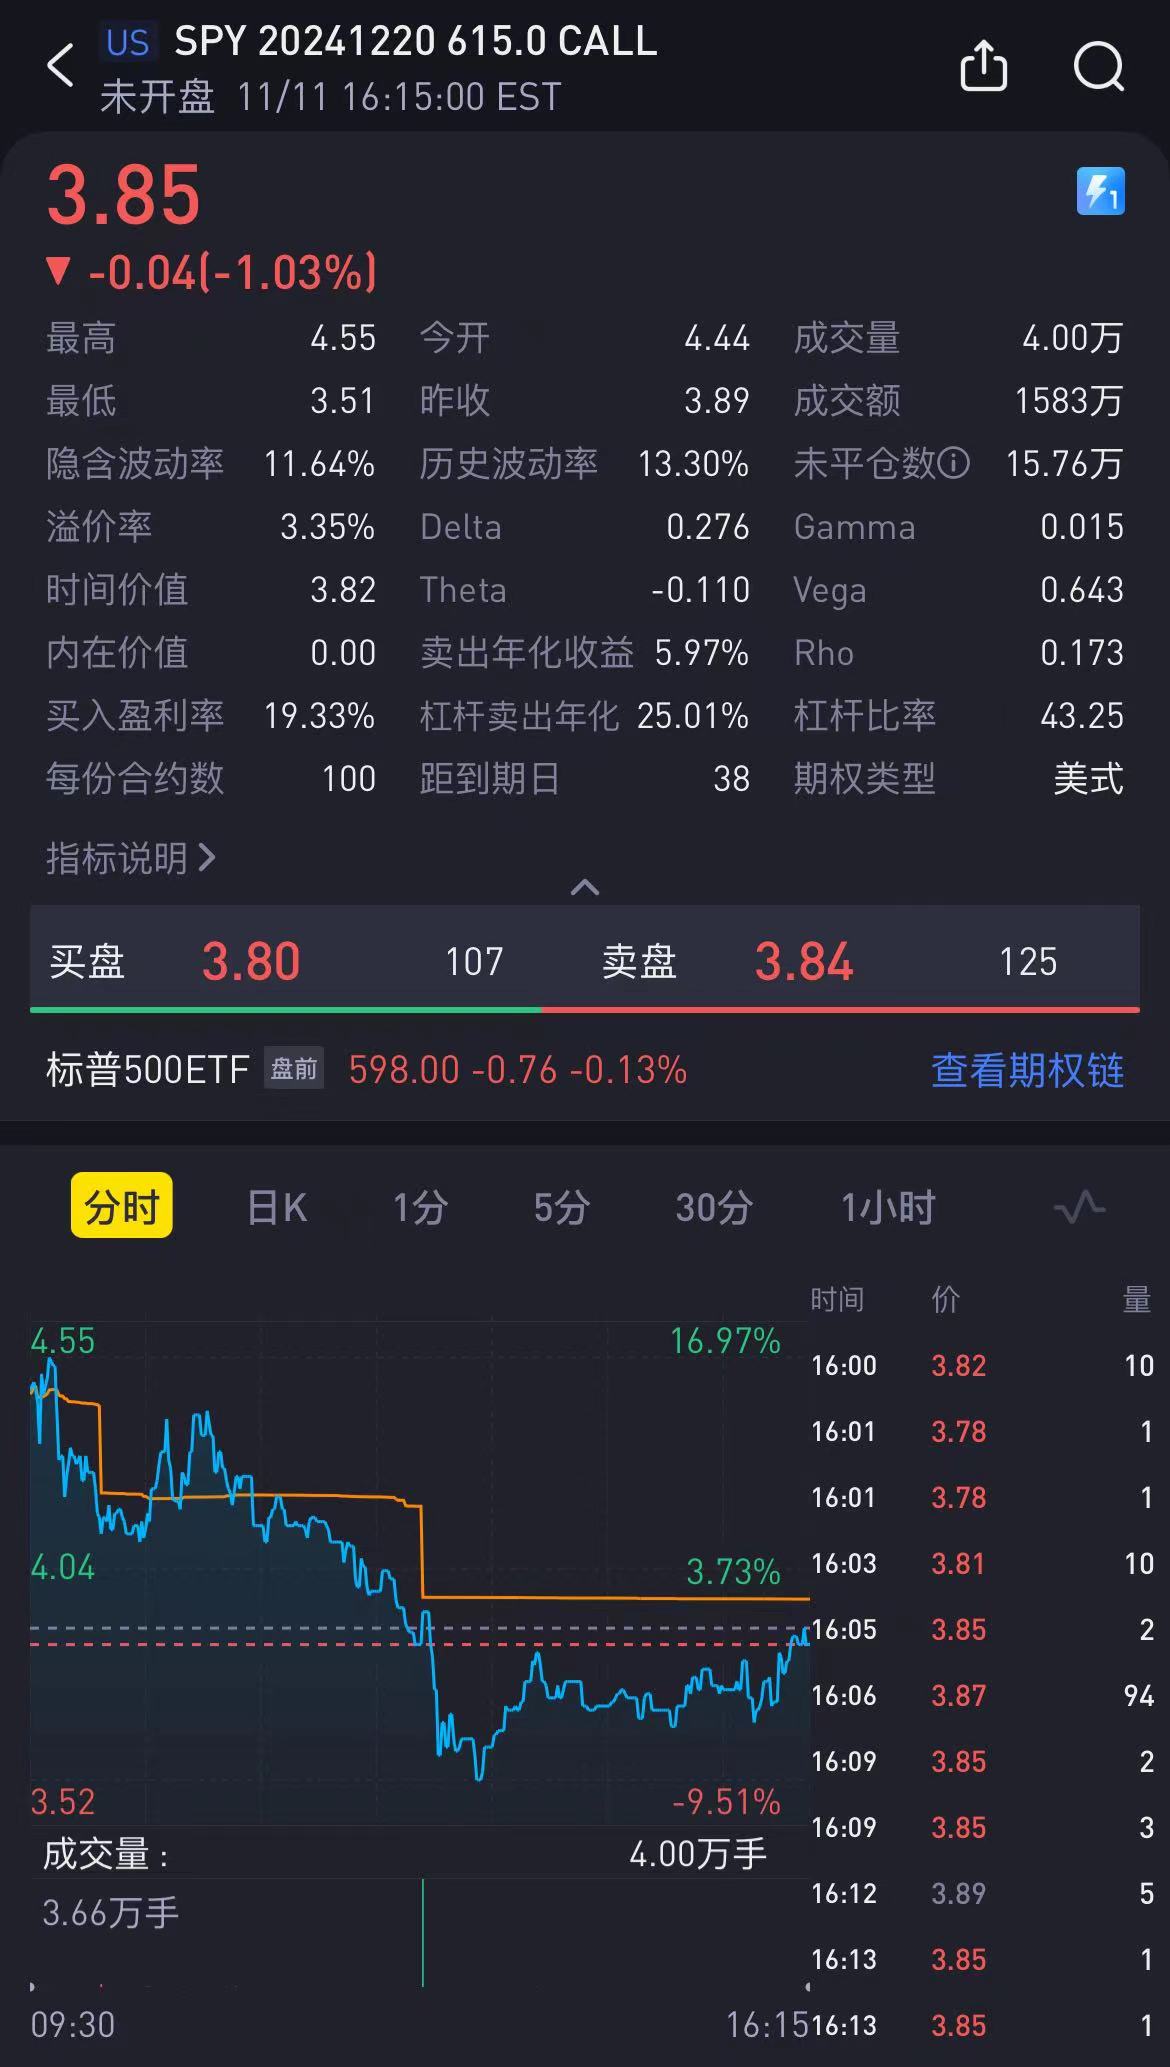
Some of the continued TSLA enthusiasm likely stems from the massive $615 SPY call buying, hedged with protective $560 put sales looking for further upside into year-end:
Buy $SPY 20241220 615.0 CALL$ for 36,600 contracts
Sell $SPY 20241220 560.0 PUT$ for 18,300 contracts
$Nvidia (NVDA)$
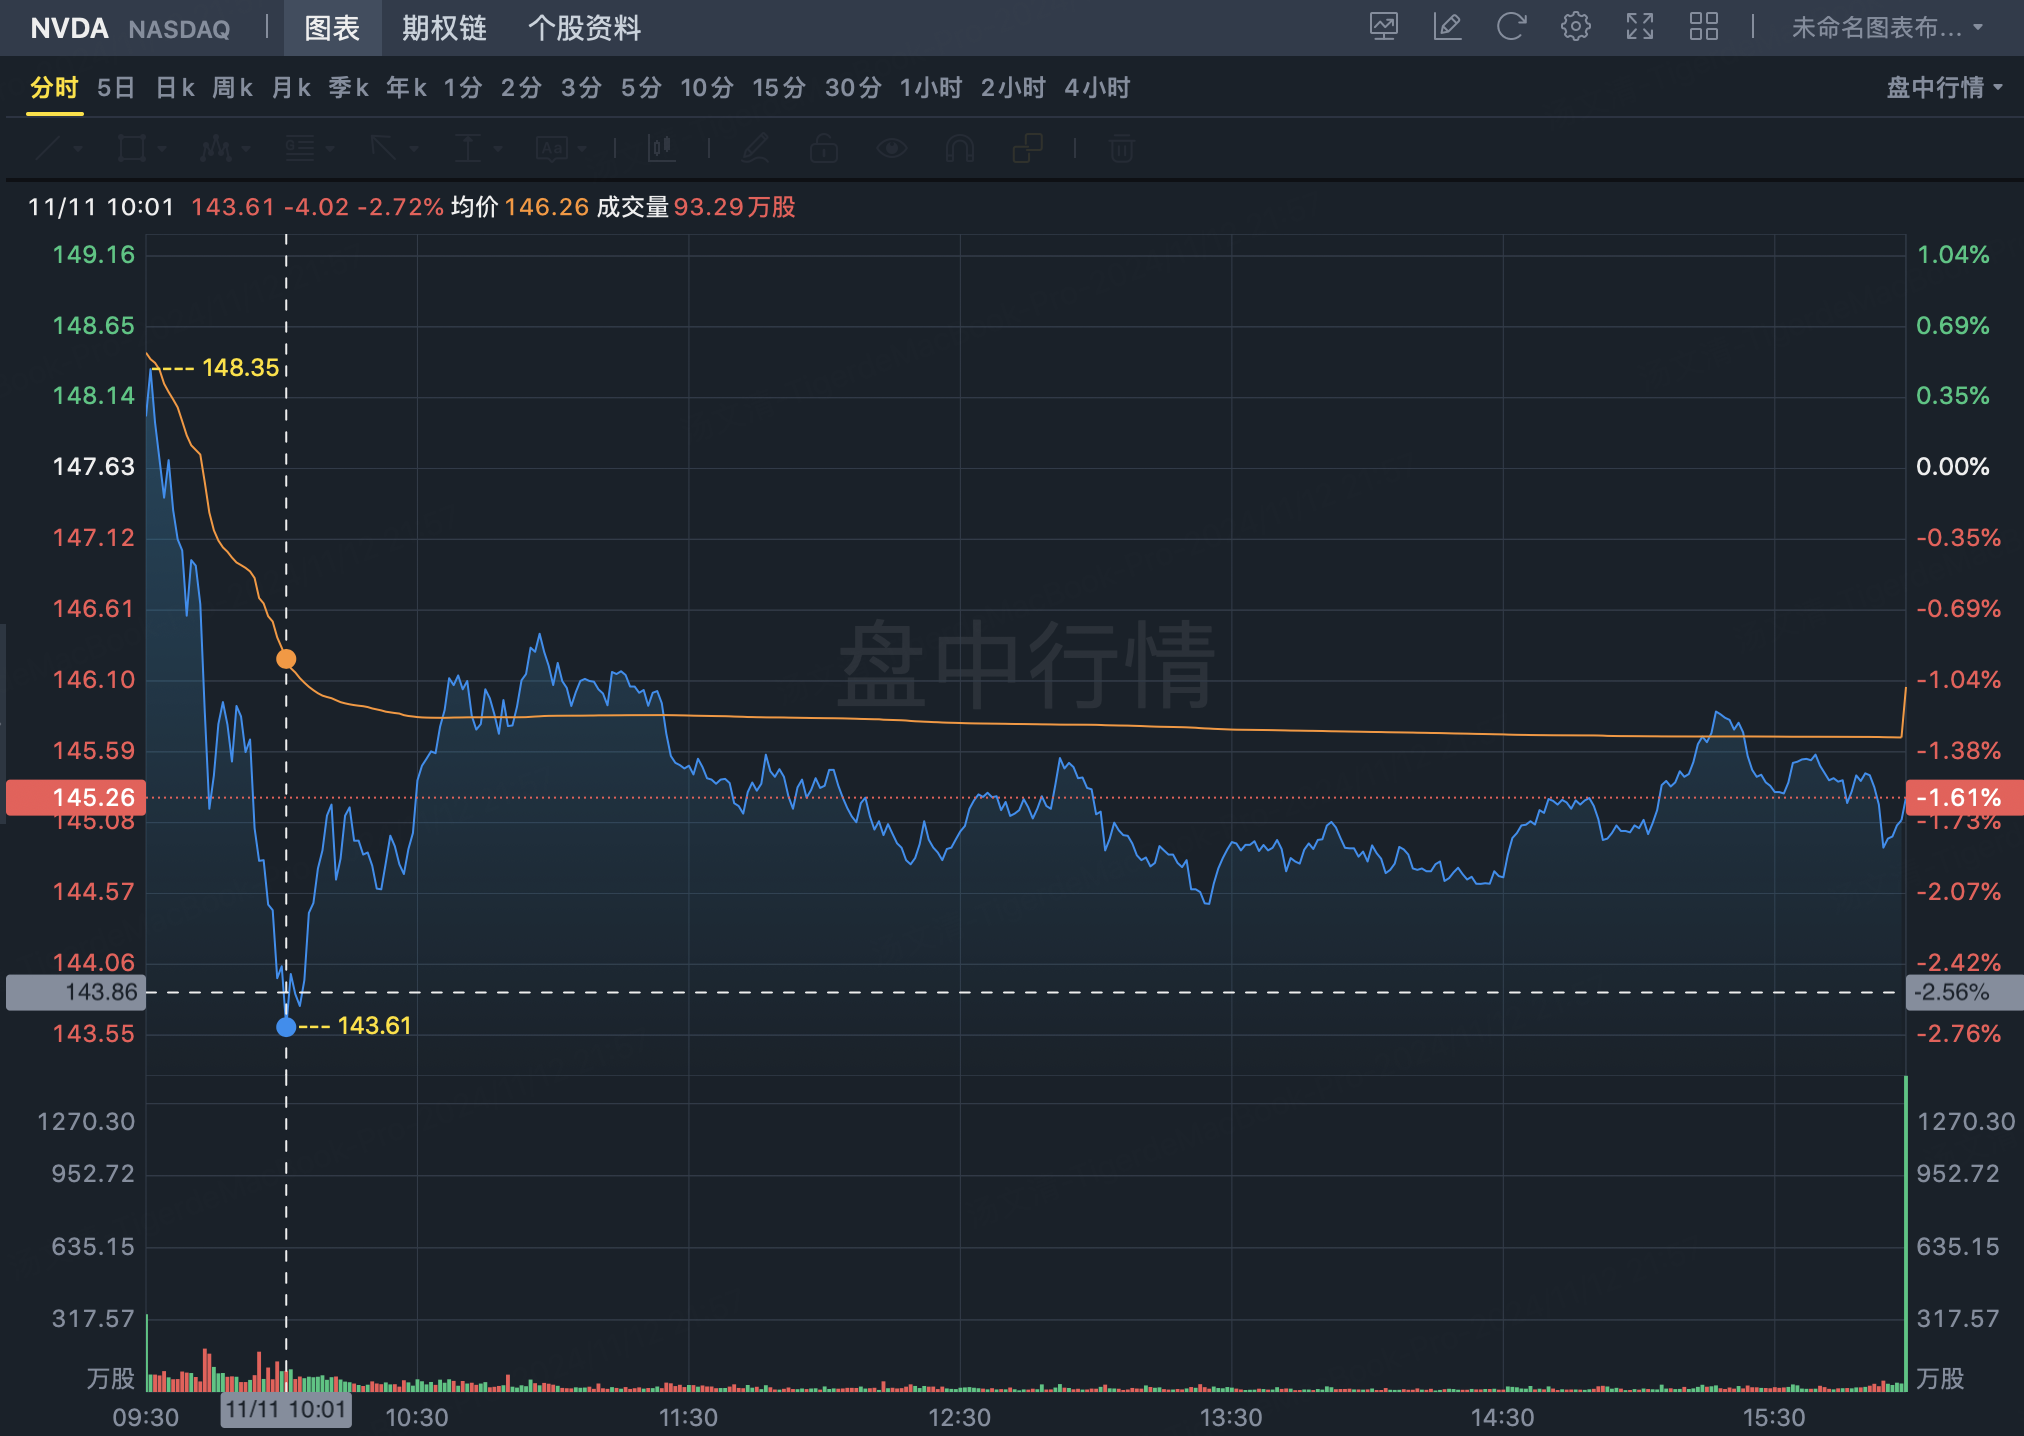
As for NVDA, Monday's largest flow printed right around 10am ET as the stock traded down over 2.5% to intraday lows.
The first flow around 10:03am appeared to be a hedge, selling upside $160 calls while buying $135 puts of equal size around 15,000 contracts each:
Sell $NVDA 20241220 160.0 CALL$
Buy $NVDA 20241220 135.0 PUT$
The second came around 10:10am, looking for a near-term bounce by buying this week's $152 calls while selling the $156 strike for a debit call spread:
Buy $NVDA 20241115 152.0 CALL$
Sell $NVDA 20241115 156.0 CALL$
On the first flow, I'm withholding judgement - my year-end NVDA target has been $170-$180 so $160 seems a tad low to be outright bearish.
The second has slightly more credibility given the timing right at the lows, looking to play a bounce. Side note - any flow selling puts after a rip or calls after a dip is typically a negative signal.
Based on open interest, ranges for NVDA this week are $130-$155 which could present favorable put selling opportunities.
I took a small put sale in the $156 weeklies ($NVDA 20241115 156.0 CALL$ ) but wouldn't recommend selling further dated calls given the richness in implied vols.


Comments