Big-Tech’s Performance
Macro Headlines This Week:
Core inflation re-accelerated but with nuance
US October core PCE rose 2.8% y/y – still above the Fed’s 2% target – yet the month-on-month pace eased. Services inflation, driven partly by surging portfolio-management fees tied to earlier equity gains, was the key driver.
Fed policy path remains the biggest wildcard
The US economy shows resilience alongside hidden cracks. Markets are increasingly focused on the $6.7 tn of Treasuries maturing in 2025–2026 (≈25% of the outstanding marketable debt). Combined with potential expansionary fiscal policy under a second Trump administration, deficit concerns are rising. CICC estimates suggest meaningful deficit reduction will be difficult in a “Trump 2.0” scenario. Any shift in Treasury issuance mix could spark yield volatility.
Cautious optimism, not euphoria
Liquidity and rate-cut expectations are still the main drivers, but fundamentals remain shaky. Much of the recent equity rally is “expectations-driven”. Any macro surprise (sticky inflation, softening jobs, or a hawkish Fed) could trigger a sharp de-rating of richly valued positions.
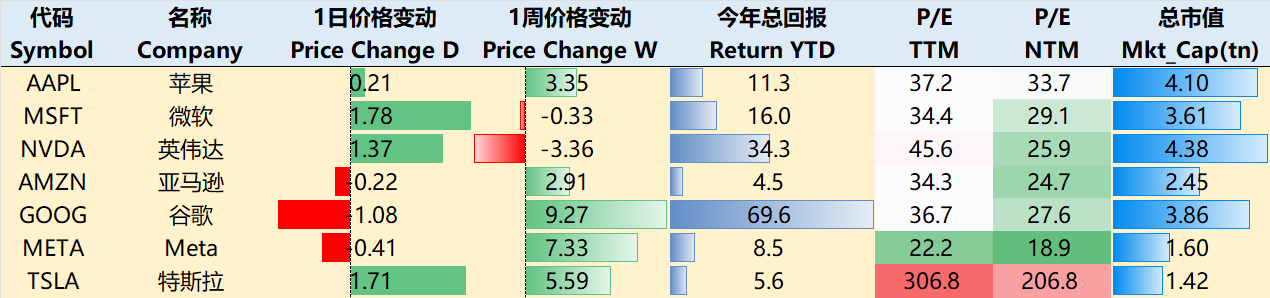
Mega-Cap Tech Performance (week ending 26 Nov 2025): $Apple(AAPL)$ +3.35%, $Microsoft(MSFT)$ –0.33%, $NVIDIA(NVDA)$ –3.36%; $Amazon.com(AMZN)$ +2.91%; $Alphabet(GOOG)$ +9.27%; $Meta Platforms, Inc.(META)$ +7.33%; $Tesla Motors(TSLA)$ +5.59%
Post-NVIDIA earnings, the sector saw rotation rather than uniform selling.
Big-Tech’s Key Strategy
How Big a Threat Are Google’s TPUs to NVIDIA’s GPU Dominance?
Money flowed out of NVIDIA and into the broader TPU ecosystem this week.
If Google fully commercialises its TPU, it poses a meaningful but not immediate existential threat to NVIDIA. In workloads involving massive-scale training and inference, TPUs offer superior total-cost-of-ownership (TCO) and energy efficiency, gradually eroding GPU demand in select segments.
Short-term impact: sentiment and procurement shifts among hyperscalers and large model developers.
Long-term outcome hinges on three factors:
Customer migration speed and switching costs
TPU pricing and business model (sell chips vs. rent racks vs. cloud service)
NVIDIA’s response speed on software ecosystem and rack-level optimisation
Technical comparison
TPUs are purpose-built ASICs optimised for tensor operations and giant Transformer models.
GPUs remain far more versatile and enjoy an entrenched CUDA/PyTorch software moat. Independent benchmarks repeatedly show TPUs delivering 2–4× better performance-per-dollar or performance-per-watt on certain models — but only when the workload and implementation perfectly match Google’s stack. Real-world migration usually requires non-trivial re-engineering.
Why Google can actually make this a credible threat
Years of internal optimisation (Gemini, etc.) give Google real reference cases.
Partnerships with Broadcom and ODMs (Inventec, etc.) for manufacturing, optical interconnects and rack integration are removing scalability hurdles.
Flexible go-to-market (sell boards, whole racks, or cloud hours) maximises disruption potential.
A Morgan Stanley note estimates that every 500k TPUs deployed externally could add ~US$13 bn of high-margin revenue to Google Cloud in a given year. At scale, TPU availability will pressure NVIDIA’s pricing power and shift bargaining dynamics with large customers.
Big Tech Options Strategies
Amazon: When Will the Market Fully Price In AWS Re-acceleration?
Morgan Stanley’s backlog modelling (RPO + new contracts) points to AWS potentially returning to ~25% y/y growth in 2026 — a material upside scenario.
Recent price action already reflects some of this optimism: Q3 revenue & EPS beat, AWS grew ≈20% y/y, advertising remains strong, and AMZN shares jumped ~12% in early November on AWS strength and reported OpenAI cloud deal.
The key swing factors for 2025–2026:
Net backlog growth in coming quarters
Sustained take-up of compute-heavy AI workloads
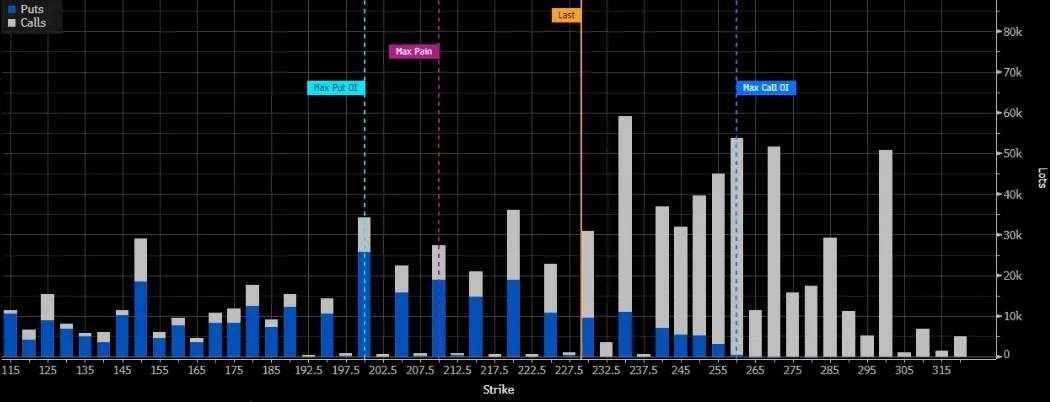
Options flow (Dec expiry)
Spot is above the max-pain strike, but put open interest is heavily skewed to far OTM strikes (200–220), while calls cluster around 250. This reflects meaningful two-sided disagreement and explains the relatively contained daily volatility.
Big Tech Portfolio
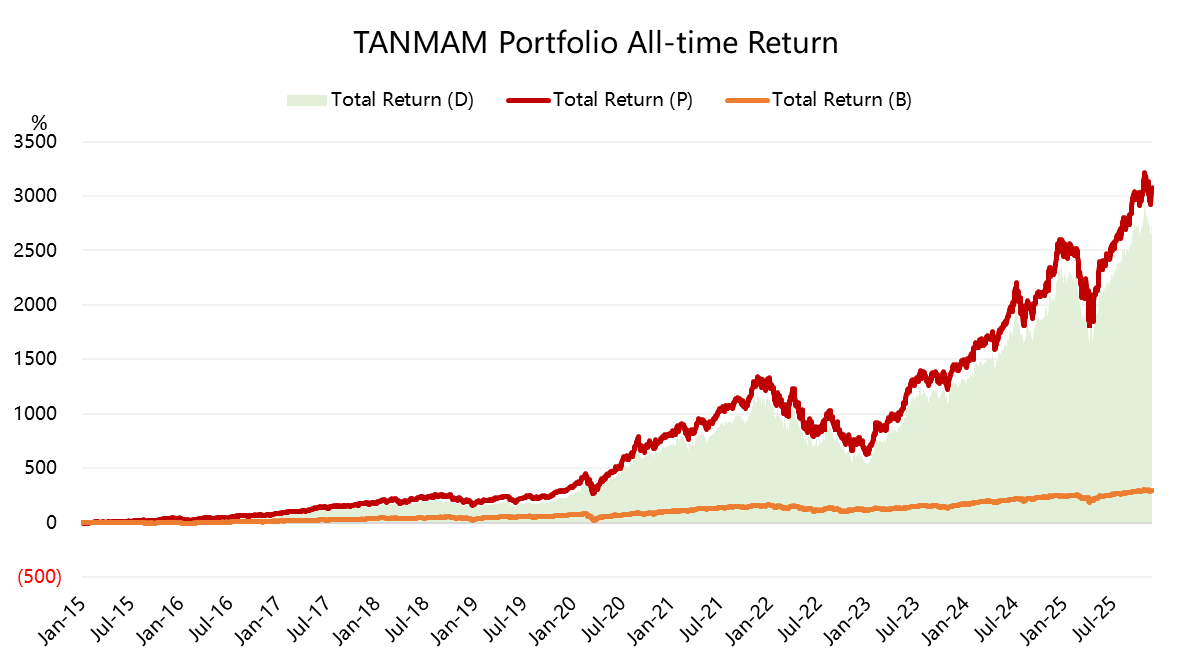
Equal-weight, quarterly rebalanced portfolio of the Magnificent Seven (“TANMAMG”):
Since 2015: +3,081% total return
Same period $SPDR S&P 500 ETF Trust(SPY)$ : +298%
Excess return: +2,783%
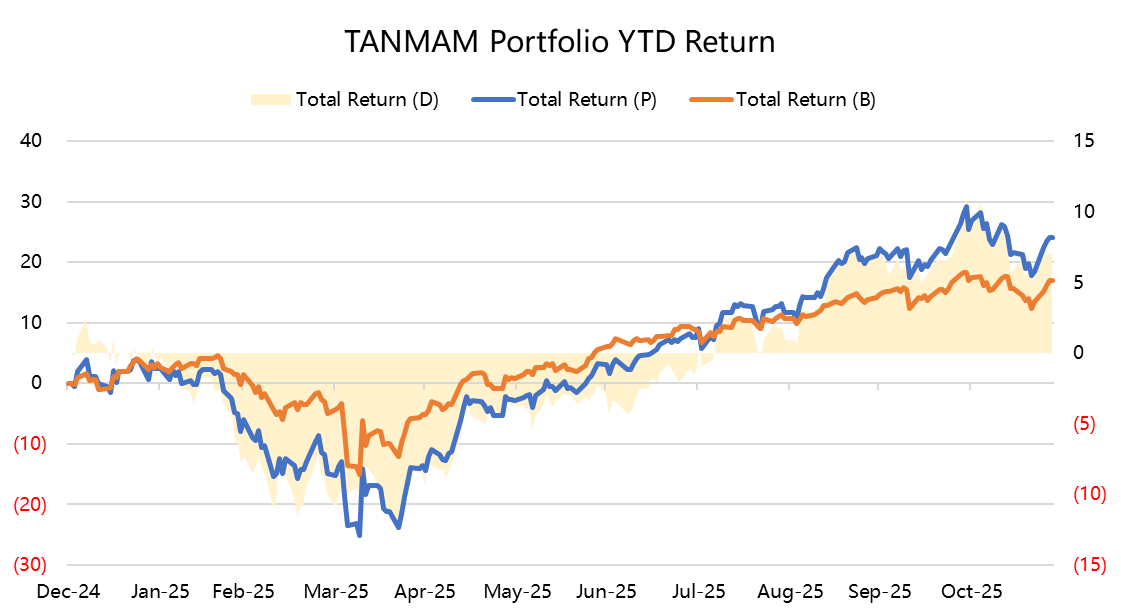
YTD 2025: TANMAMG +24.0% vs SPY +17.0%
The concentration risk is real, but historically the basket continues to deliver outsized returns even at elevated valuations.
Comments