Michael Widmer, head of metals research at Bank of America, expects gold to remain a key portfolio hedge in 2026, with prices likely to average an ounce$4538, and silver may be inUS $135-309Range-bound. Widmer pointed out that falling gold supply and rising production costs will support prices, while producer profitability will be greatly improved.
He believes that there is still room for underinvestment in the gold market, and the bull market may continue. Investment demand only needs to increase by 14% to push the gold price to $5,000. He emphasized that the allocation ratio of gold in the investment portfolio is low, and both retail investors, high-net-worth investors and central banks can obtain diversified returns by increasing gold allocation.
In addition, silver may outperform gold at a high gold-silver ratio, and U.S. monetary policy and interest rate movements will be key factors driving precious metal prices. Overall, Bank of America maintains a positive view on gold and the precious metals market as a whole.
Profit and Loss Analysis of GLD Bull Put Spread Strategy
1. Strategy structure
Investors in$Gold ETF-SPDR (GLD) $Establish a Bull Put Spread strategy on options. The strategy passesSell higher strike price Put while buying lower strike price PutConstitute, belonging toA long strategy with limited risk and limited return。
The core objectives are:
In judging GLD expirationHigh probability of not falling below $400Under the premise of
By selling the Put spreadOne-time collection of net premium
Take advantage of Buy Put at the same timeHedging Extreme Downside Risks
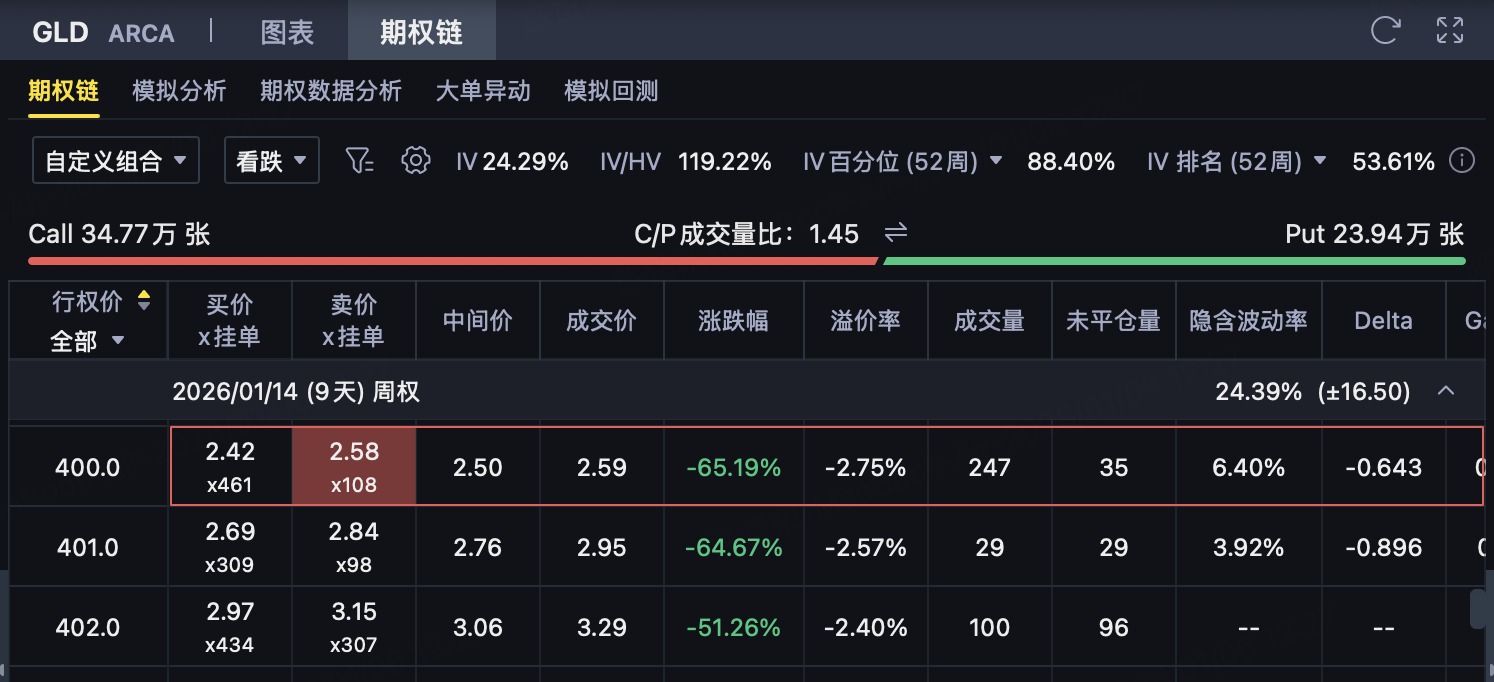
(1) Sell at a higher execution price Put (main source of income)
Investors sell a strike priceK ₂ = 400Put options, receive premium$2.59。
This Put is closer to the current price and is the main source of premium for this strategy. As long as the GLD expiration price≥ $400, the option will be completely invalid, and investors can retain all premium rights.
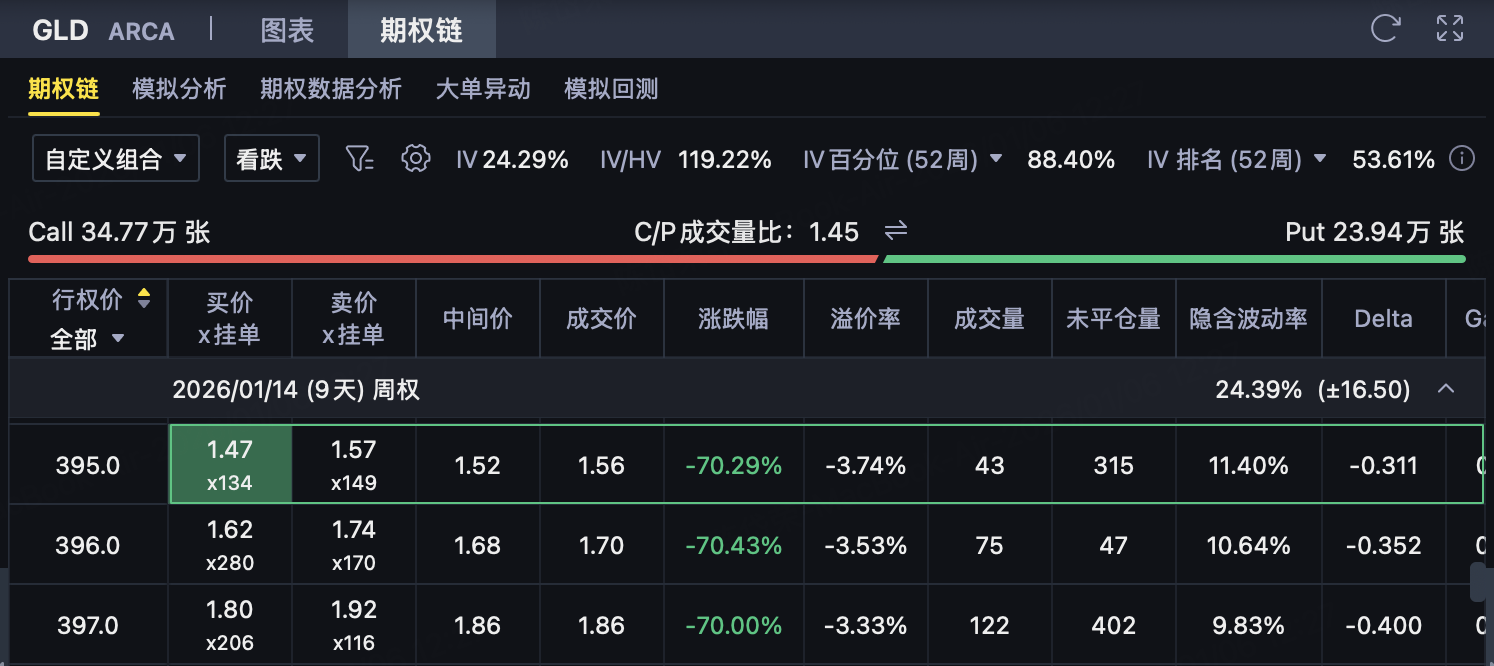
(2) Buy a lower execution price Put (risk protection)
Investors buy one strike price at the same timeK ₁ = 395Put options, pay premium$1.56。
This Put is used to limit the maximum loss when there is a significant decline in GLD, capping the risk of the overall strategy.
(3) Put-side net income (per share)
Net premium = Sell Put − Buy Put = 2.59 − 1.56 =$1.03/Share
Initial net income
Since 1 lot of options = 100 shares:
Net premium (per share):$1.03
Initial net income (per contract): = 1.03 × 100 =$103/contract
The initial net income is the bull market put spread strategyMaximum potential profit。
3. Maximum profit
When GLD Expiration Price≥ $400Time:
395 Put and 400 Put are extra-price
Both options lapse
Investors get maximum profits:
Per share:$1.03
Per contract:$103
4. Maximum loss
The largest loss occurs whenPut spread fully triggeredThe situation, that is, GLD has dropped significantly.
Strike spread width: = 400 − 395 =$5
Maximum loss (per share): = Strike spread − Net premium = 5 − 1.03 =$3.97/Share
Maximum loss (per contract): = 3.97 × 100 =$397/contract
Conditions of occurrence:
GLD Expiration Price≤ $395
5. Break-even point
There is only one break-even point for bull put spreads:
Breakeven Price = Sell Put Strike Price − Net premium = 400 − 1.03 =$398.97
Maturity judgment rules:
GLD > $398.97 → Earnings for Investors
GLD = $398.97 → No Profit, No Loss
GLD < $398.97 → Investor losses
6. Risk and return characteristics
Maximum benefit:$103/contract (limited)
Maximum loss:$397/Contract (Limited)
Profit-loss ratio: gain: loss ≈ 103: 397 ≈1: 3.85
Strategy Characteristics
Bullish strategy, the core assumption isGLD No Significant Drop
Receive time value by selling Put
The maximum risk and maximum return can be clarified when opening a position
Don't require GLD to rise sharply, just maintain above the key price
Applicable situations
When investors judge:
GLD in the short termShock or moderate rise
Before expirationUnlikely to fall below $400
And hopefully inIdentify the maximum riskObtain premium income on the premise of
Comments