Yes, you are not mistaken. Although US stocks have declined sharply in recent days, a large number of US stock investors have already started to bargain-hunt.
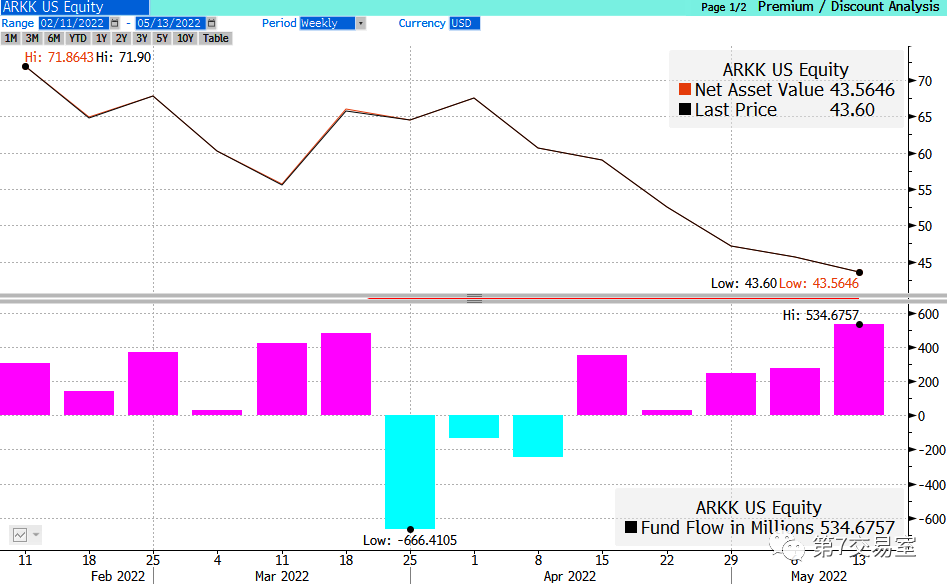
For example, ARKK, just in the past week, ARKK's capital inflow was the most in the previous week.
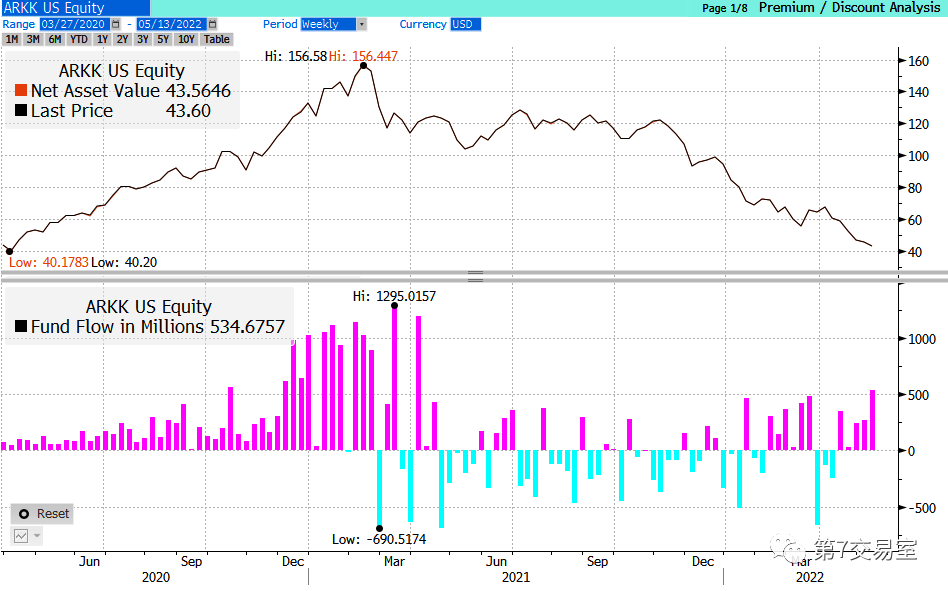
In one week, ARKK's net equity fund purchases reached a record $534 million, which is almost the sum of the net inflow of funds in the previous two weeks. But more importantly, ARKK's fund position has maintained a net inflow trend for five consecutive weeks, but during these five weeks, ARKK's market value plummeted by 39%.
The more market fall, the more you buy? Why are US stock investors not afraid of losing money?
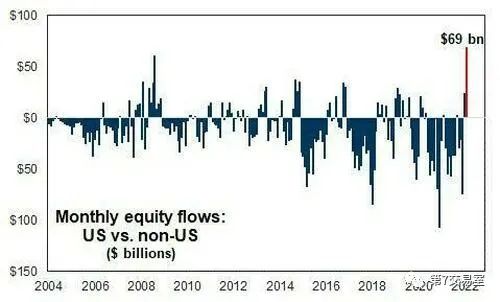
Not only ARKK, but also statistics from Goldman Sachs show that in April, when the US stock market plummeted wildly, the net inflow of funds from US stock funds VS non-US funds rose sharply, and the data set a new high in the past 20 years.
Is't it very strange.?
The trend of bear market have not changed
In the past few days, the US stocks are still running according to the script I shared before, and neither the short-term rebound nor the long-term bearish indicators have changed much.
However, in the past week, there has been a bear market rebound in US stocks. You should pay attention to the fact that if this rebound can form a technological breakthrough, there will be a considerable structural great buying opportunity in the short term. But last night, a big shade line of US stocks showed that a short-term sharp rebound may still need time to brew.
The bargain-hunting funds we see are probably bought in desperation to gain the benefits of this bear market rebound. You know, the risk of buying US stocks at this stage will be very great.
However, once the bottoming pattern of the short-term stock market is established, the benefits brought by the oversold rebound will be very considerable.
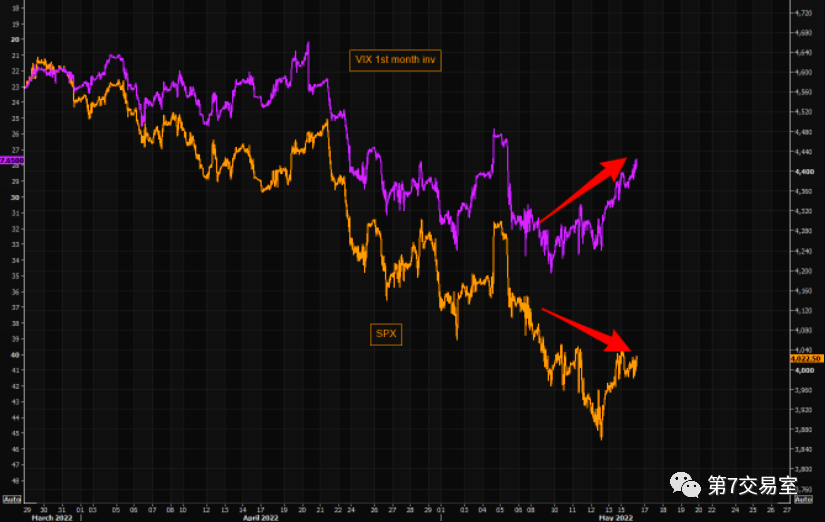
Look at VIX's reaction, which also indicates that the short-term structural bullish of US stocks.
With the slight rebound of US stocks, the decline of VIX (inverted in the figure) is significantly larger than the rebound of S&P, and when S&P finished its last decline, VIX had already double-peaked. In this way, maybe there is still room for S&P to go up.
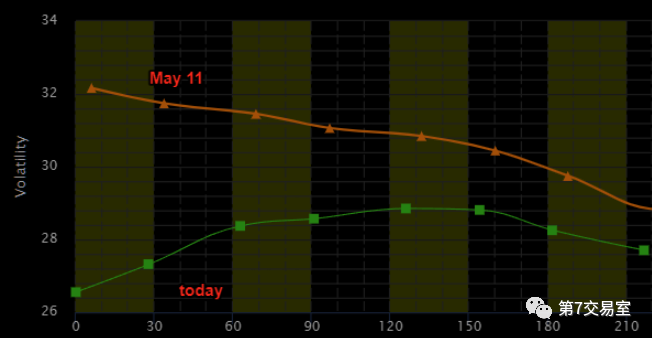
Moreover, the futures price structure of VIX shows that the backwardation pattern on May 11th has completely collapsed , which is usually caused by the futures market changing from extremely bullish spot to bearish spot, and the recent decline of VIX may not be over yet.
In the options market, the trading position (red) of call option CALL of Nasdaq ETF began to bottom out and hit the highest position since 2008. The ratio of put and call of S&P 500ETF plummeted recently. It seems that more and more option traders no longer short, but bet more on long positions.
The future of short-term breakthrough
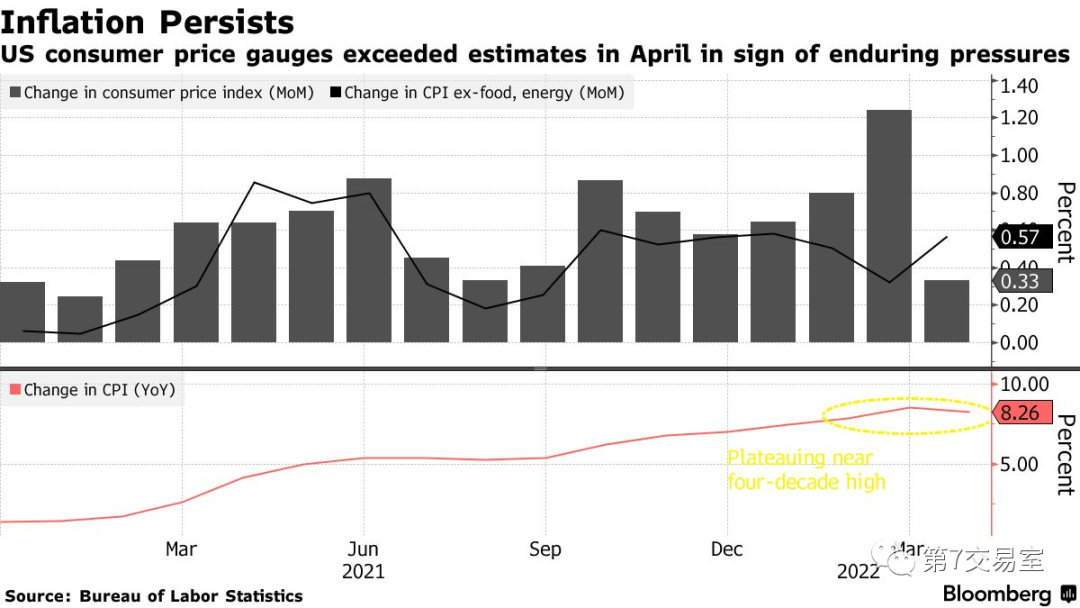
We should pay great attention to the inflation data of the United States every month in the future,. In the latest two CPI and PPI data released, we can see that the growth rate of the two data has dropped month on month. Although the range is less than expected, it at least gives the hope that the inflation rate will peak.
The year-on-year growth rate of CPI has peaked and declined, and the month-on-month growth rate of CPI has also shown the lowest growth rate in nine months.
In particular, the price of crude oil, which represents the industrial cost, fluctuates at more than 110 positions, and there is no crazy rise. If the CPI increase falls again next month,We may really have to seriously consider a big positive that Goldman Sachs had expected: US inflation will peak and fall back.
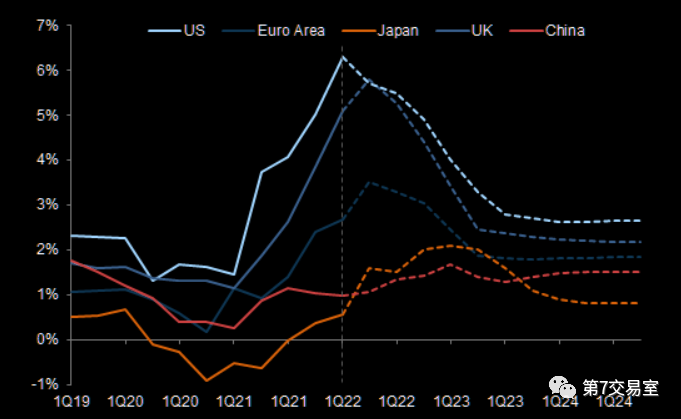
This is Goldman Sachs' forecast of inflation trends in various countries. They think that the inflation rate in the United States may peak and fall back in the first half of this year.
Every bear market rebound is quite large
If inflation really peaks, it may rebound by more than 20 percentage points,, which is the routine of US stocks.
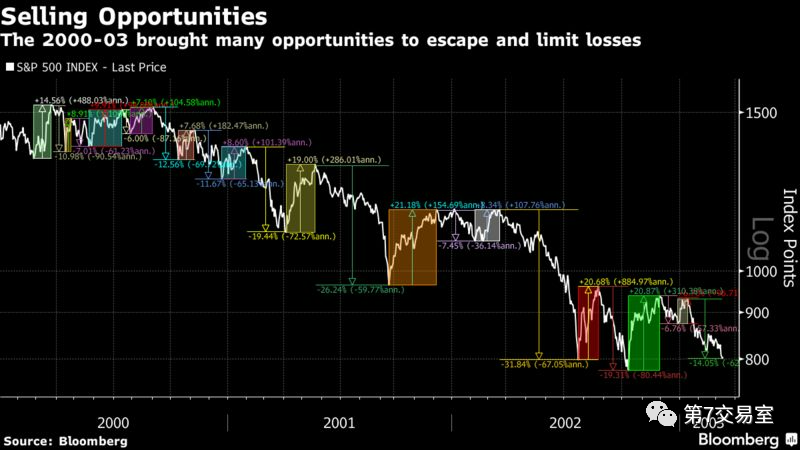
Let's look at the rebound in the bear market decline of S&P from 2000 to 2003.
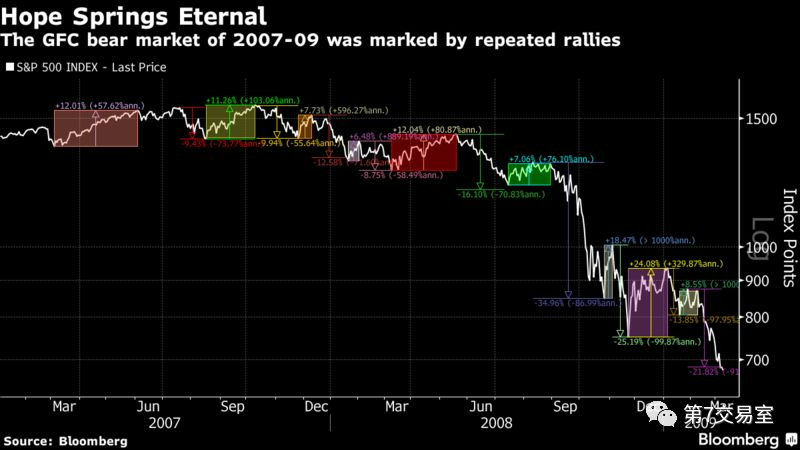
Look at the bear market rebound from 2007 to 2009
If you look at the Nasdaq, the rebound range of the Nasdaq in the long-term decline can reach 56%, and it is more common for the rebound range to exceed 30%.
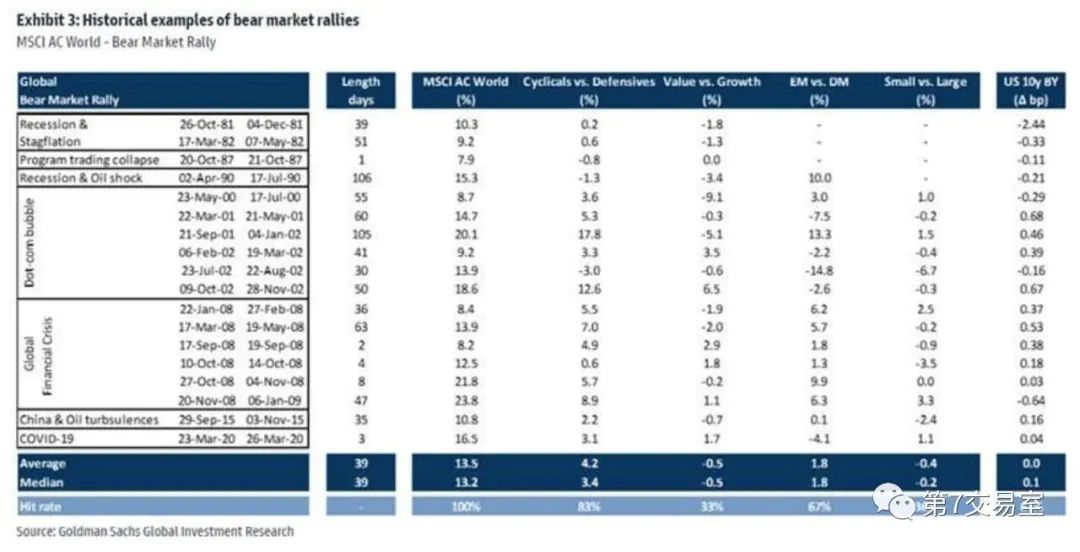
According to Goldman Sachs' statistics, the study on the extent of 18 bear market rebounds in history shows that the average duration of bear market rebound is 39 days, and the average rebound range of MSCI AC world indexes is 13.5%.
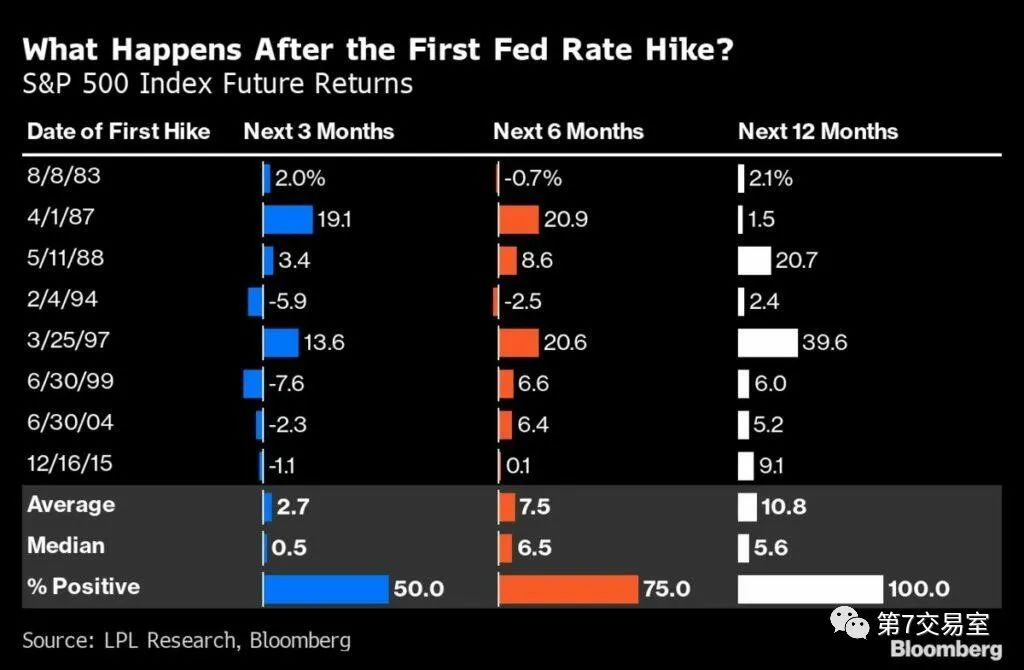
In the historical data of S&P futures returns compiled by Bloomberg, after the Fed raised interest rates for the first time, the average returns after three months, six months and one year were 2.7%, 7.5% and 10.8% respectively, while the probability of positive returns was 50%, 75% and 100% respectively.
The combination of the two results is similar to what we estimated in the previous period: October is likely to be the end time point of this bear market, and the probability of positive returns in the first three months, that is April to June, is 50%,
If you're still wondering about another question:
WHEN Will the bear market end?
At least for now, we haven't seen any signs of long-term change. We haven't seen the speed of inflation falling, the possibility of fundamental improvement of corporate profits, and the weakening of the Fed's expectation of raising interest rates. . .
Therefore, when these key contradictions are not resolved,
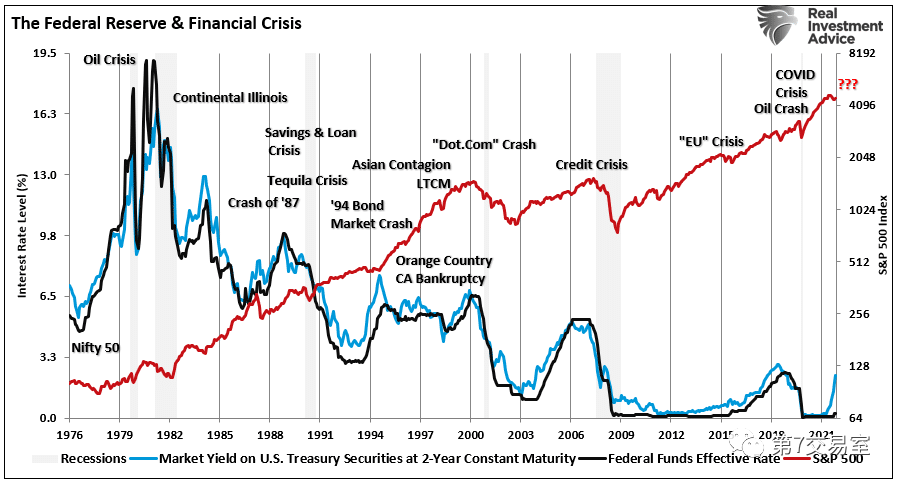
We see that every time the Federal Reserve raises the federal interest rate, there will always be a decent downfall by S&P, but it is only a matter of duration and sooner or later. What's more, this taper is accompanied by many years of QE policy withdrawal.
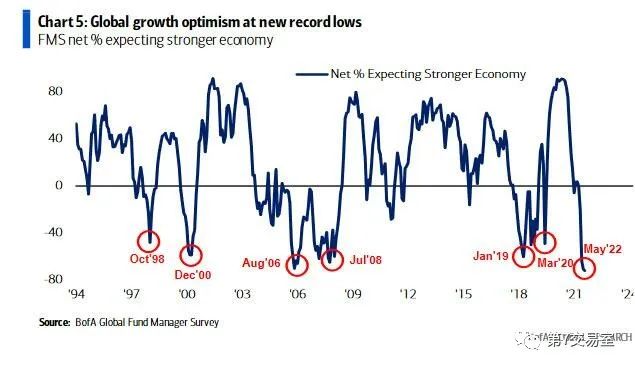
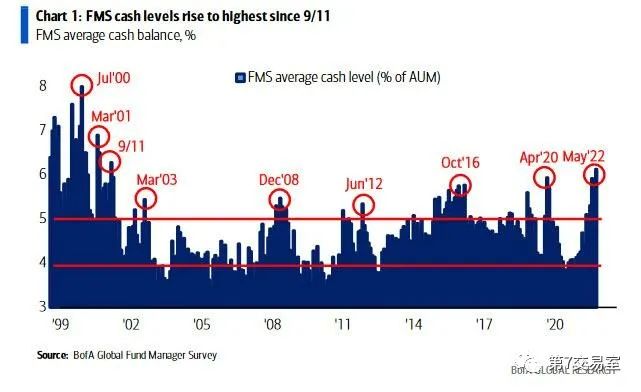
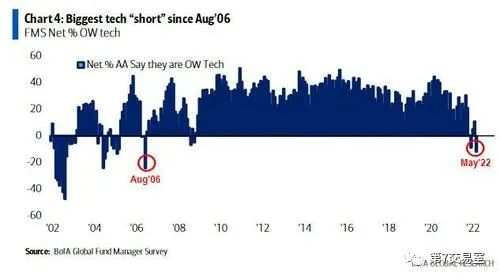
On May 18th, Bank of America just released the latest FMS investigation report, which is also known as FUND MANAGER SUREY American fund manager investigation report. The results show that people on Wall Street are generally bearish on the future market.
We only excerpt the three most important survey results, and let's feel them.
First, the number of fund managers who expect the economy to continue to be strong in the future is the lowest in 94 years.
Second, the average ratio of cash held by managers is the highest since the financial crisis in 2002.
Finally, and most importantly, the number of short positions in technology stocks is the highest since 2006.
After reading this, do you still doubt the future bear market trend of US stocks?
$NQmain(NQmain)$ $GCmain(GCmain)$ $CLmain(CLmain)$ $ESmain(ESmain)$ $YMmain(YMmain)$
Comments