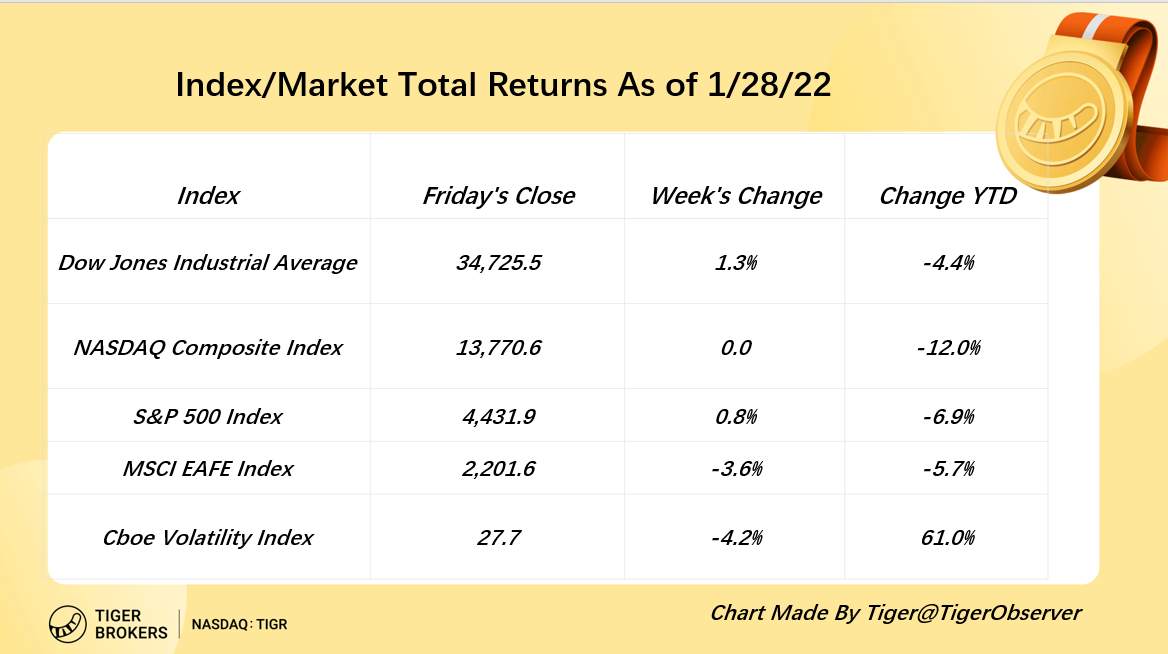
For a whole picture of 1 month, Nasdaq dropped 12% this month, the worst start in 50 years,The Dow and S&P 500 fell 5.70% and 7.73%, respectively, also setting their worst start to the year since 2009.
Related Reading:Stock Market Sell-off Causes The Worst January Since 2009—Then What??
A closer look at last week, the three major indexes reversed their decline with Friday’s performance: S&P 500 Index, Dow Jones Industrial Average Index and NASDAQ Composite Index rose 0.77%, 1.34% and 0.01% respectively.
Weekly Index Returns From Last Week
Other Markets:
Crude oil rose for six consecutive weeks, and Brent oil closed above $90 for the first time in more than seven years; U.S. and European natural gas rose more than 22% and 15%, respectively; The 10-year U.S. Treasury yield fell below 1.8% again during the session, reversing the gains made after the FED meeting; the 2-year yield turned lower after hitting a new high in nearly two years. The U.S. dollar index fell from a two-year high.
Macro Factors:
Under the blow of the FED's hawkish signal, the major U.S. stock indexes almost continued to fall last week, until the strong performance of Apple came forward and led a group of technology stocks to turn the tide on last Friday, which saved the U.S. stocks and Nasdaq avoid a five-week losing streak for the first time in nine years.
U.S. natural gas rose by more than 20% in a week, boosted by the cold winter storm warning in the northeastern U.S. and contract expiration, and crude oil prices were boosted by regional tensions in Russia.
If we step back and look at where we are in the economic cycle, we continue to believe that we are still in the middle innings of this economic expansion. The economy remains in midcycle – no recession in sight.

Recommend Reading:
Weak US Dollar Trend in 2022? Are Stocks Still The Best to Invest in?
Oil Price Touches New High Since 2014: 3 Top Oil Stocks to Buy
WGC Believes Gold Will Outperform in 2022, GLD Shows the Biggest Inflow Since 2004
S&P 500 11 Sectors Weekly Performances
Compared to the previous week's full-scale decline, the 11 sectors of the S&P 500 were mixed last week. Energy sector rose 3.67%, Financial sector rose 1.47%, Technology sector rose 0.4%,Communication Services rose 0.36%,Healthcare rose 0.18%。Consumer Cyclical declined 2.15%,Basic Materials Sector declined 2.12%,Industrials declined 1.88%,Utilities declined 1.13%,Real Estate declined 0.58%,Consumer Defensive declined 0.47%.
In terms of monthly sector performance, only energy sector stocks rose by 14.21% in January, while all other sectors fell. Financial sector declined 0.28%,Consumer Defensive declined 2.69%,Basic Materials declined 4.45%,Utilities declined 4.51%,Real Estate declined 9.05%,Healthcare declined 10%,Communication Services declined 10.39%,Comsumer Cyclical declined 12.79%,Technology declined 13.35%。
Overall:
In the context of Rate Hikes, technology stocks are sensitive to interest rates and have retreated sharply in the context of high valuations.But it is a positive environment for financial stocks.
Recently, some bank stocks have also reported good earnings,why the whole financial stocks performed soso?Recommend Reading: Bank Stocks falling Sharply After Earnings, Is There a Safe Haven in This Market?
In the absence of a reversal of the Pandemic, the consumer discretionary sector is expected to decline and perform poorly. But consumer staples were more resilient.International demand rises, energy stocks are expected to rise,Recommend Reading:Weekly Sectors Recap: Why Energy, Financials, Consumer, Material are top Gains?

Comments