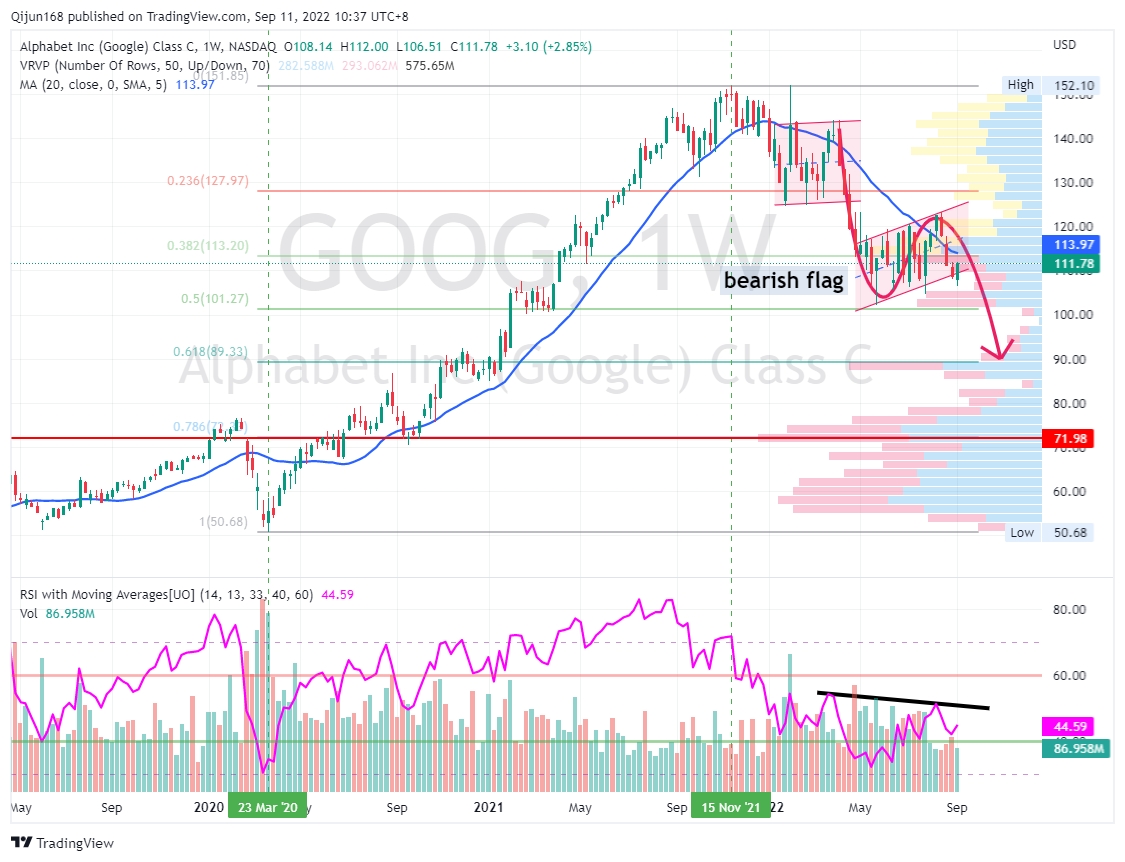
$Alphabet(GOOG)$$Alphabet(GOOGL)$Weekly chart, Bearish Flag heading down to $90
1. previous bearish flag formed between Jan~Apr 2022
2. currently, another bearish flag is potentially forming as shown
3. share price continues to pressure below 20 SMA (Simple Moving Average)
Support - $90 (20% downside, 61.8% Fibonacci retracement level)
Resist - $117 (approximate)
If you find this analysis helpful, please like and comment[Heart]
Disclaimer: Investing carries risk. This is not financial advice. The above content should not be regarded as an offer, recommendation, or solicitation on acquiring or disposing of any financial products, any associated discussions, comments, or posts by author or other users should not be considered as such either. It is solely for general information purpose only, which does not consider your own investment objectives, financial situations or needs. TTM assumes no responsibility or warranty for the accuracy and completeness of the information, investors should do their own research and may seek professional advice before investing.
Comments