
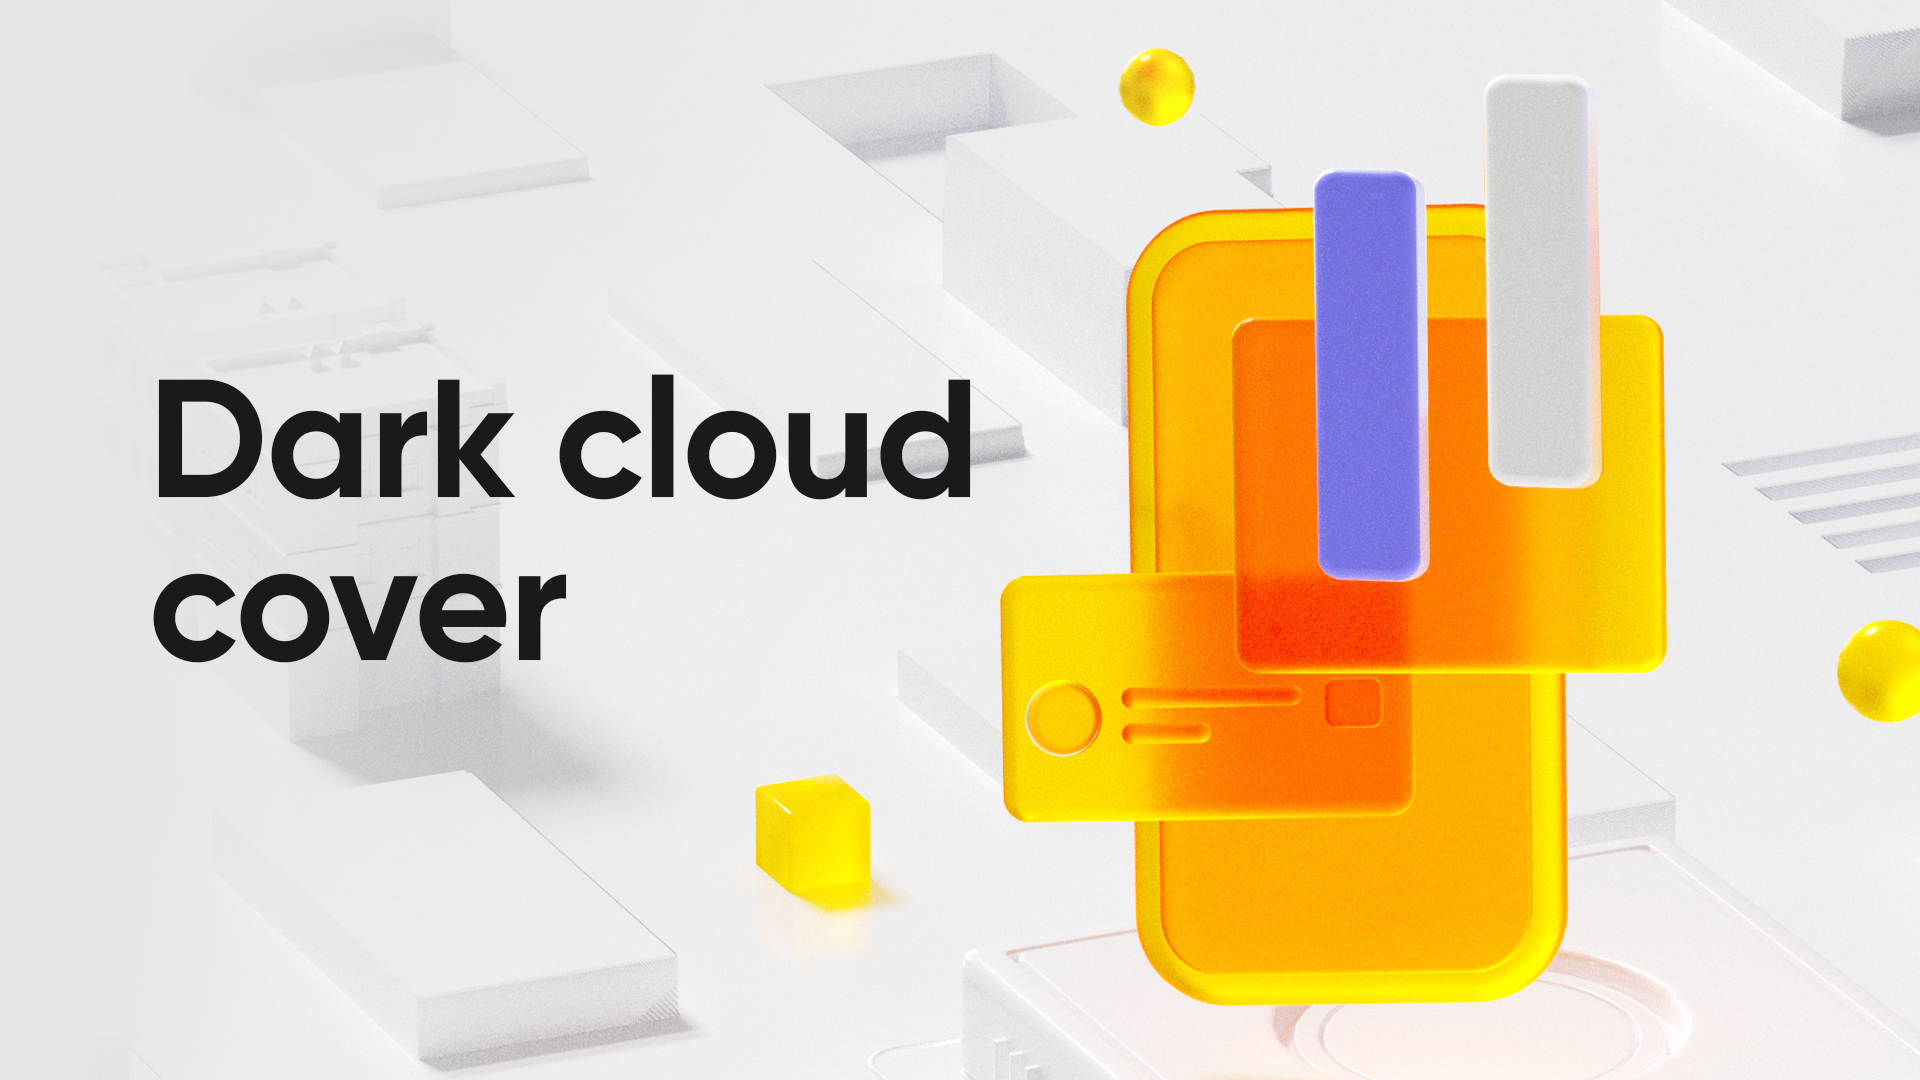
Dark Cloud Cover is a common technical analysis pattern that typically appears in an uptrend, indicating a potential trend reversal.
In simple terms, the Dark Cloud Cover is a bearish pattern based on technical analysis.
This pattern suggests that there is selling pressure during an uptrend, which may signal the end of the uptrend and a reversal to a downtrend.
The Dark Cloud Cover pattern generally implies a change in market sentiment, which may result in a price drop. Investors who notice this pattern may consider reducing their position or taking a short position.
What constitutes a Dark Cloud Cover pattern? Generally, this technical pattern has three distinct characteristics:
1.It consists of two candlesticks, with the first candlestick being an uptrend candle and the second candlestick being a downtrend candle.
2.The body of the second candlestick covers at least half of the first candlestick.
3.The two candlesticks appear at the top of the stock price or at a phase top.
Let's use two examples to better understand the Dark Cloud Cover pattern, such as:
Apple Inc.
On July 20-21, 2015, after a continuous uptrend, Apple Inc.'s stock price showed a Dark Cloud Cover pattern (interval top), indicating that the price might drop. Subsequently, Apple's stock price experienced a period of decline.

Tesla, Inc.
On January 3-4, 2021, after an uptrend, Tesla's stock price showed a Dark Cloud Cover pattern (interval top), indicating that the subsequent stock price might drop. Subsequently, Tesla's stock price did indeed decline for a period of time.

Regarding the Dark Cloud Cover pattern and similar technical patterns, you should also note the following:
1.Not all Dark Cloud Cover patterns will result in a stock price drop.
For example, Tesla showed a Dark Cloud Cover pattern on January 27-28, 2023, but the subsequent stock price continued to rise. Therefore, a single Dark Cloud Cover pattern cannot determine the direction of a stock price trend. You still need to combine other technical indicators such as moving averages, relative strength indicators, or combine with news and fundamentals to confirm the trend direction.

2.It can be used to determine stop loss and take profit points.
Since technical patterns can only be used as reference factors for trading, if you decide to take a short position or reduce your position after the appearance of a Dark Cloud Cover pattern, you need to set reasonable stop loss and take profit points.
Stop loss refers to the point at which you must close your position and take a loss when the loss reaches a certain level.
Take profit refers to the point at which you must close your position and take a profit when the profit reaches a certain level.
That's all about the knowledge of the Dark Cloud Cover technical pattern! We welcome you to join the activity and win prizes.
【Reply to Win Rewards】
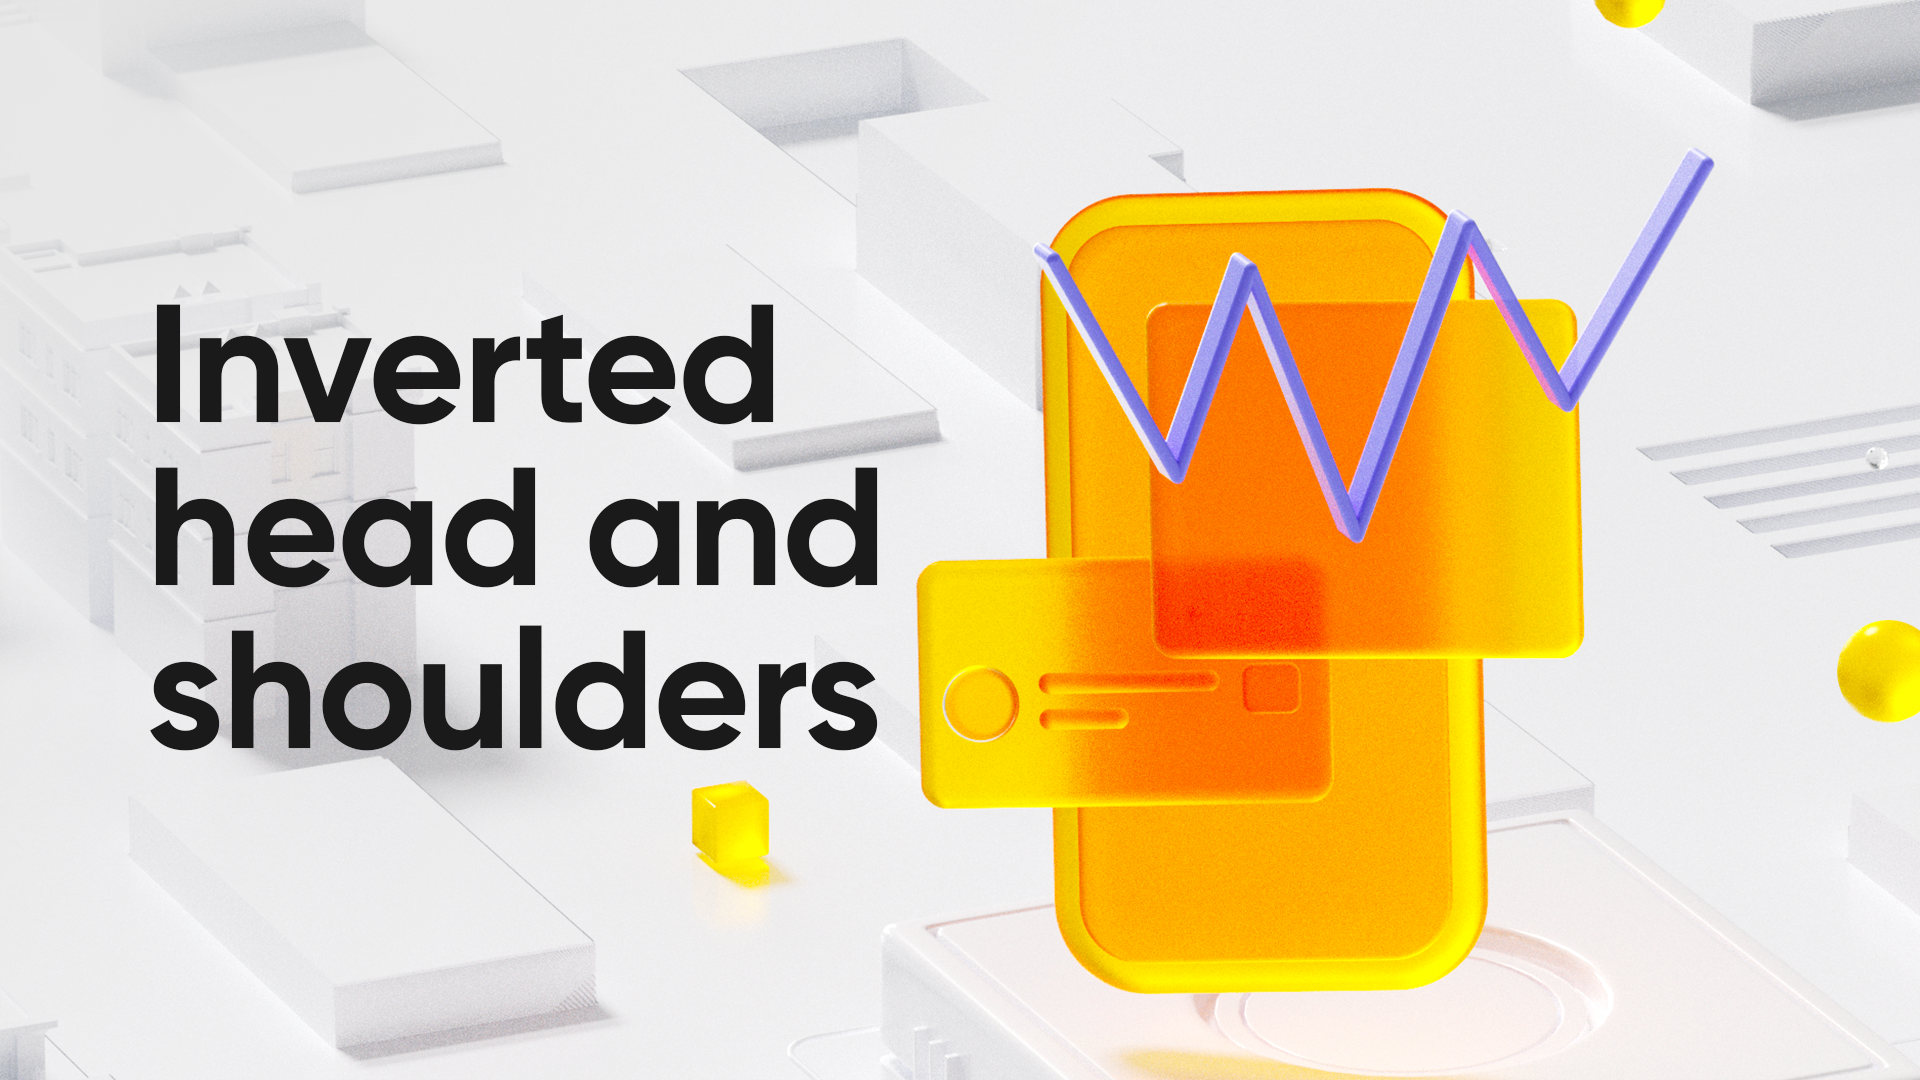
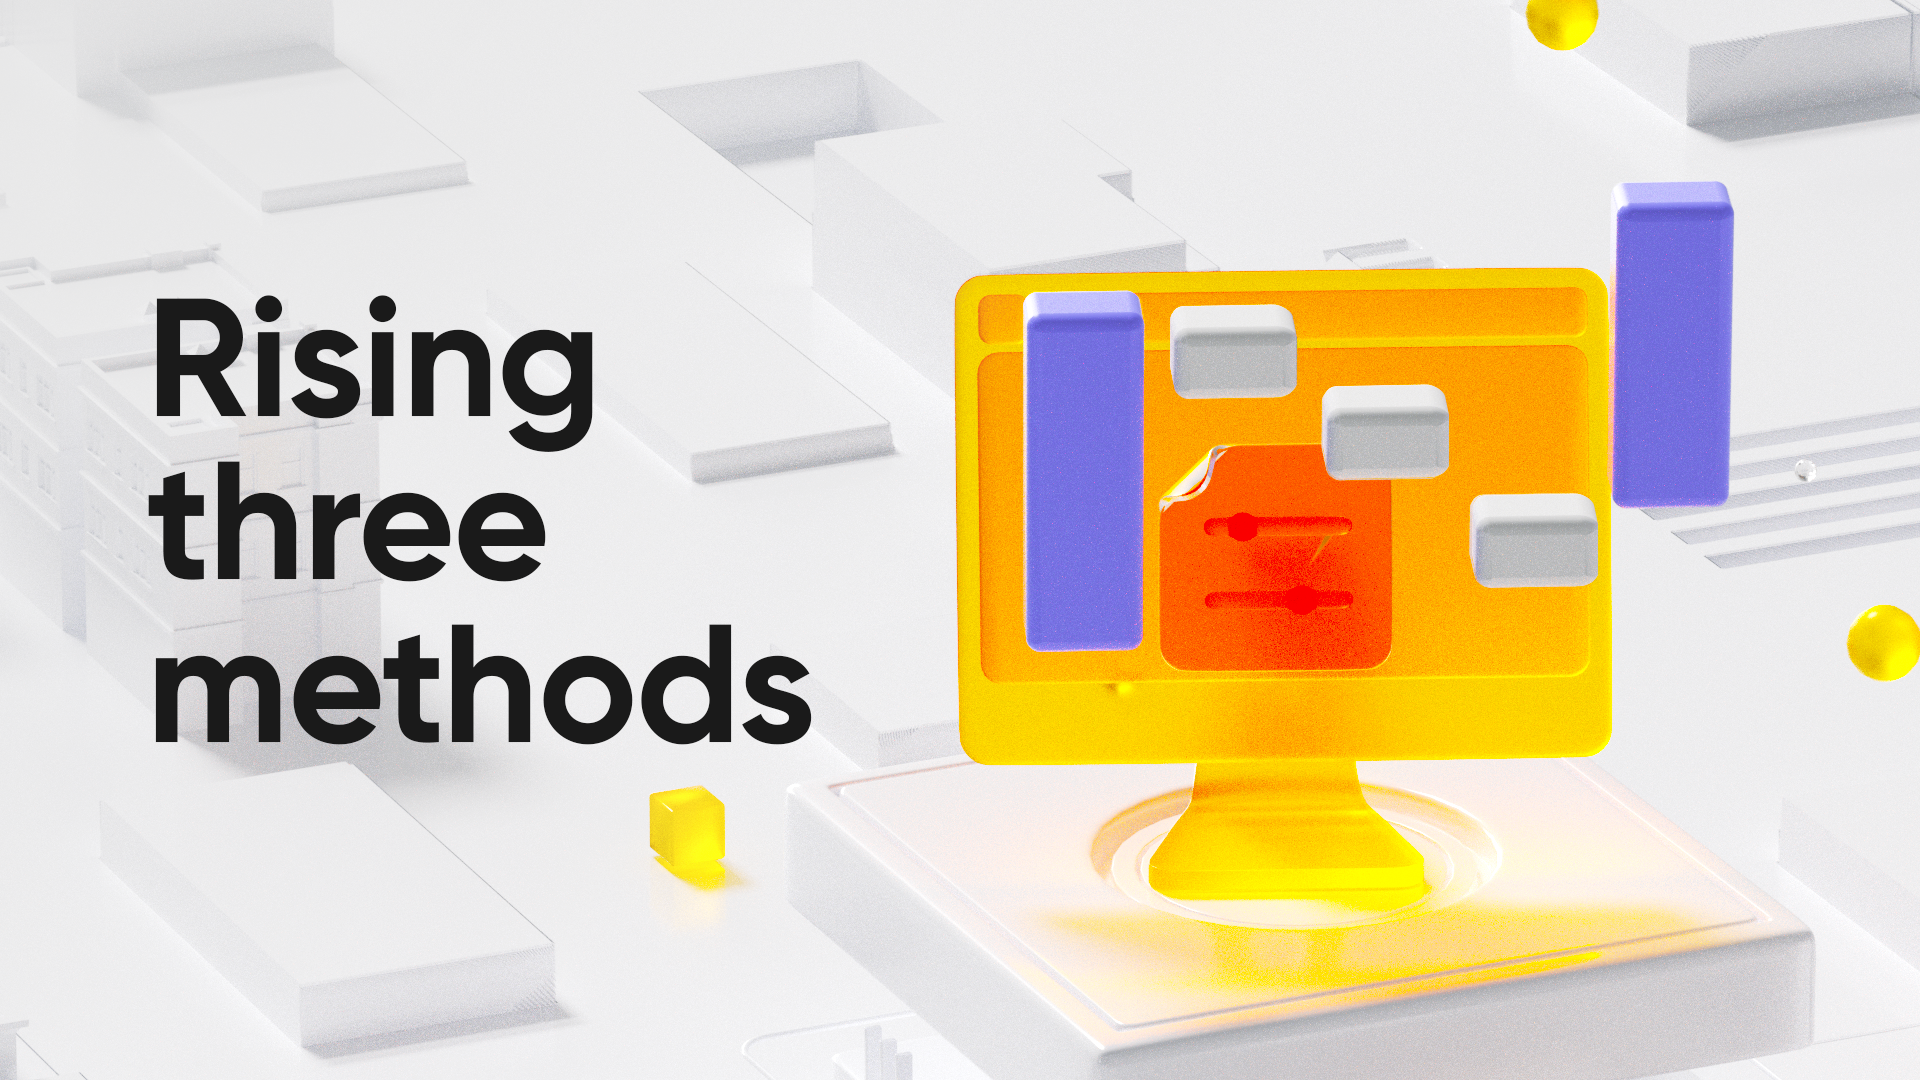
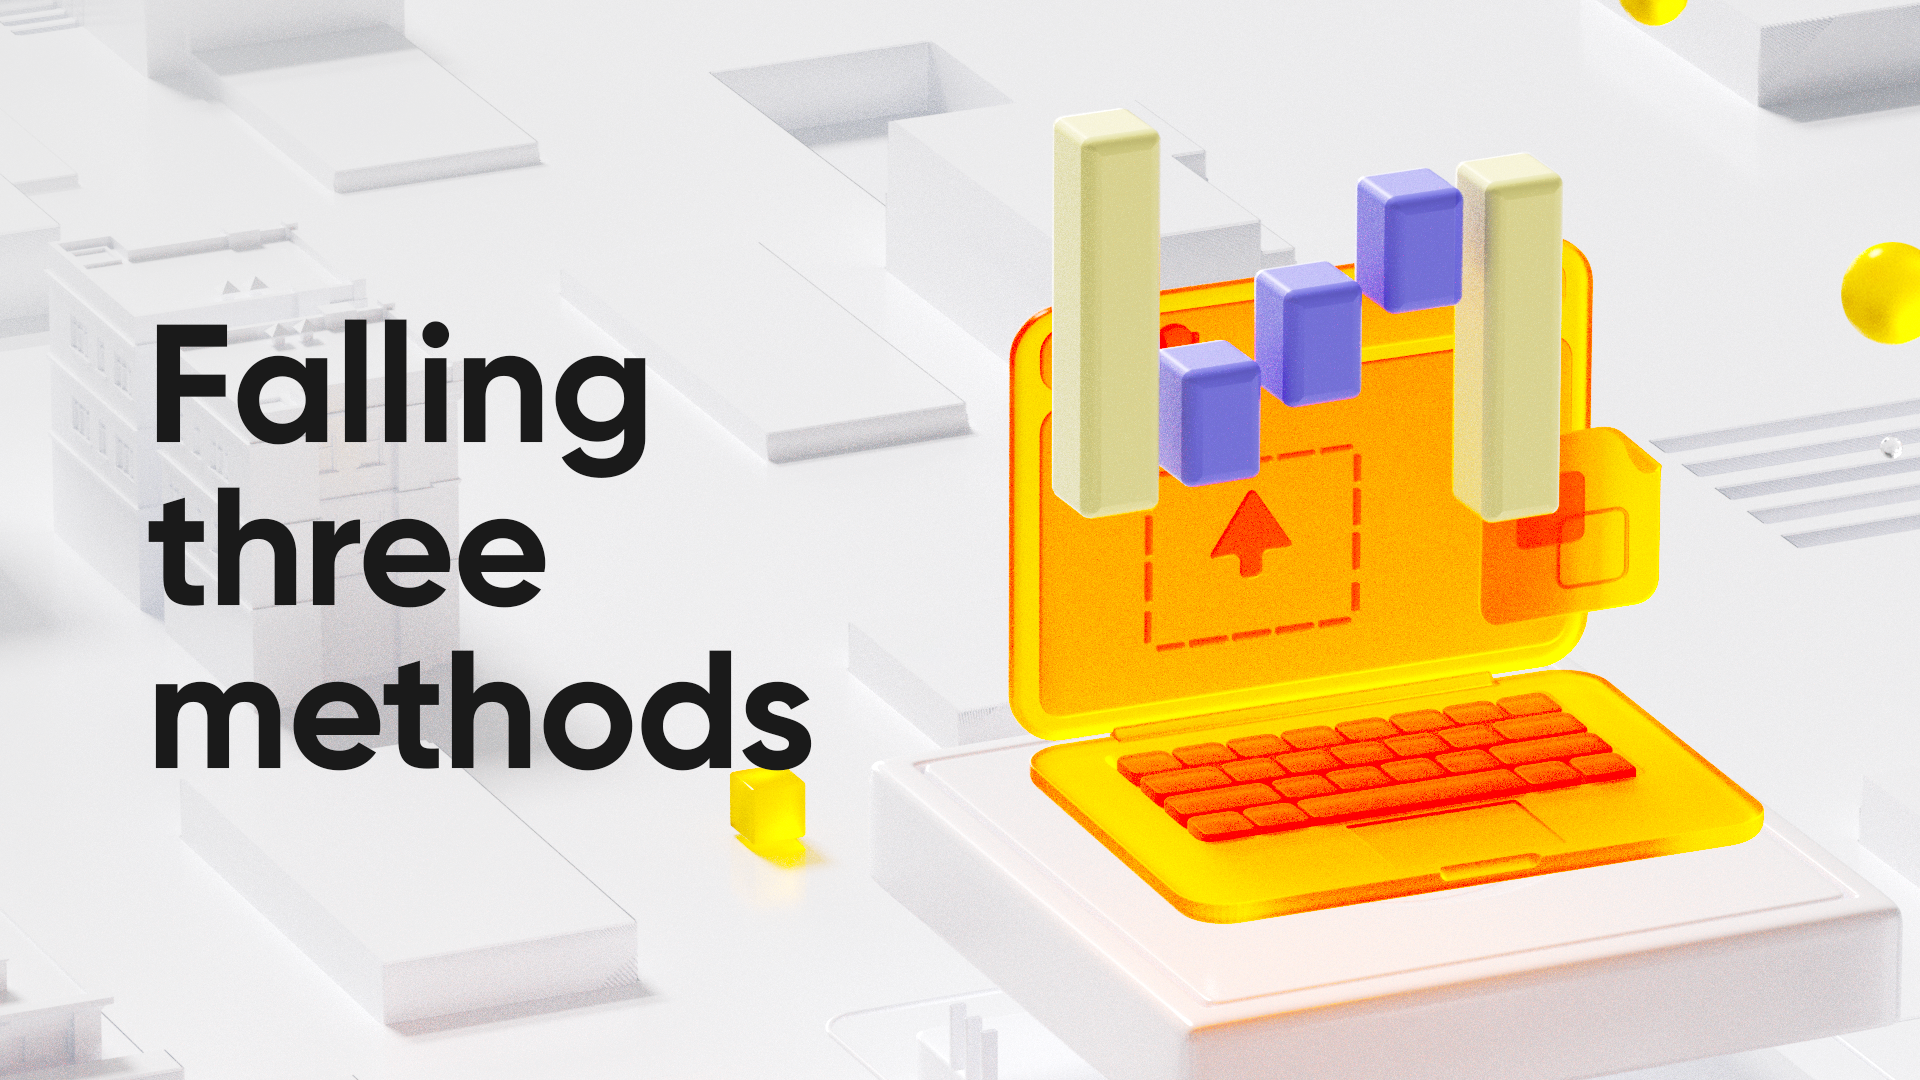
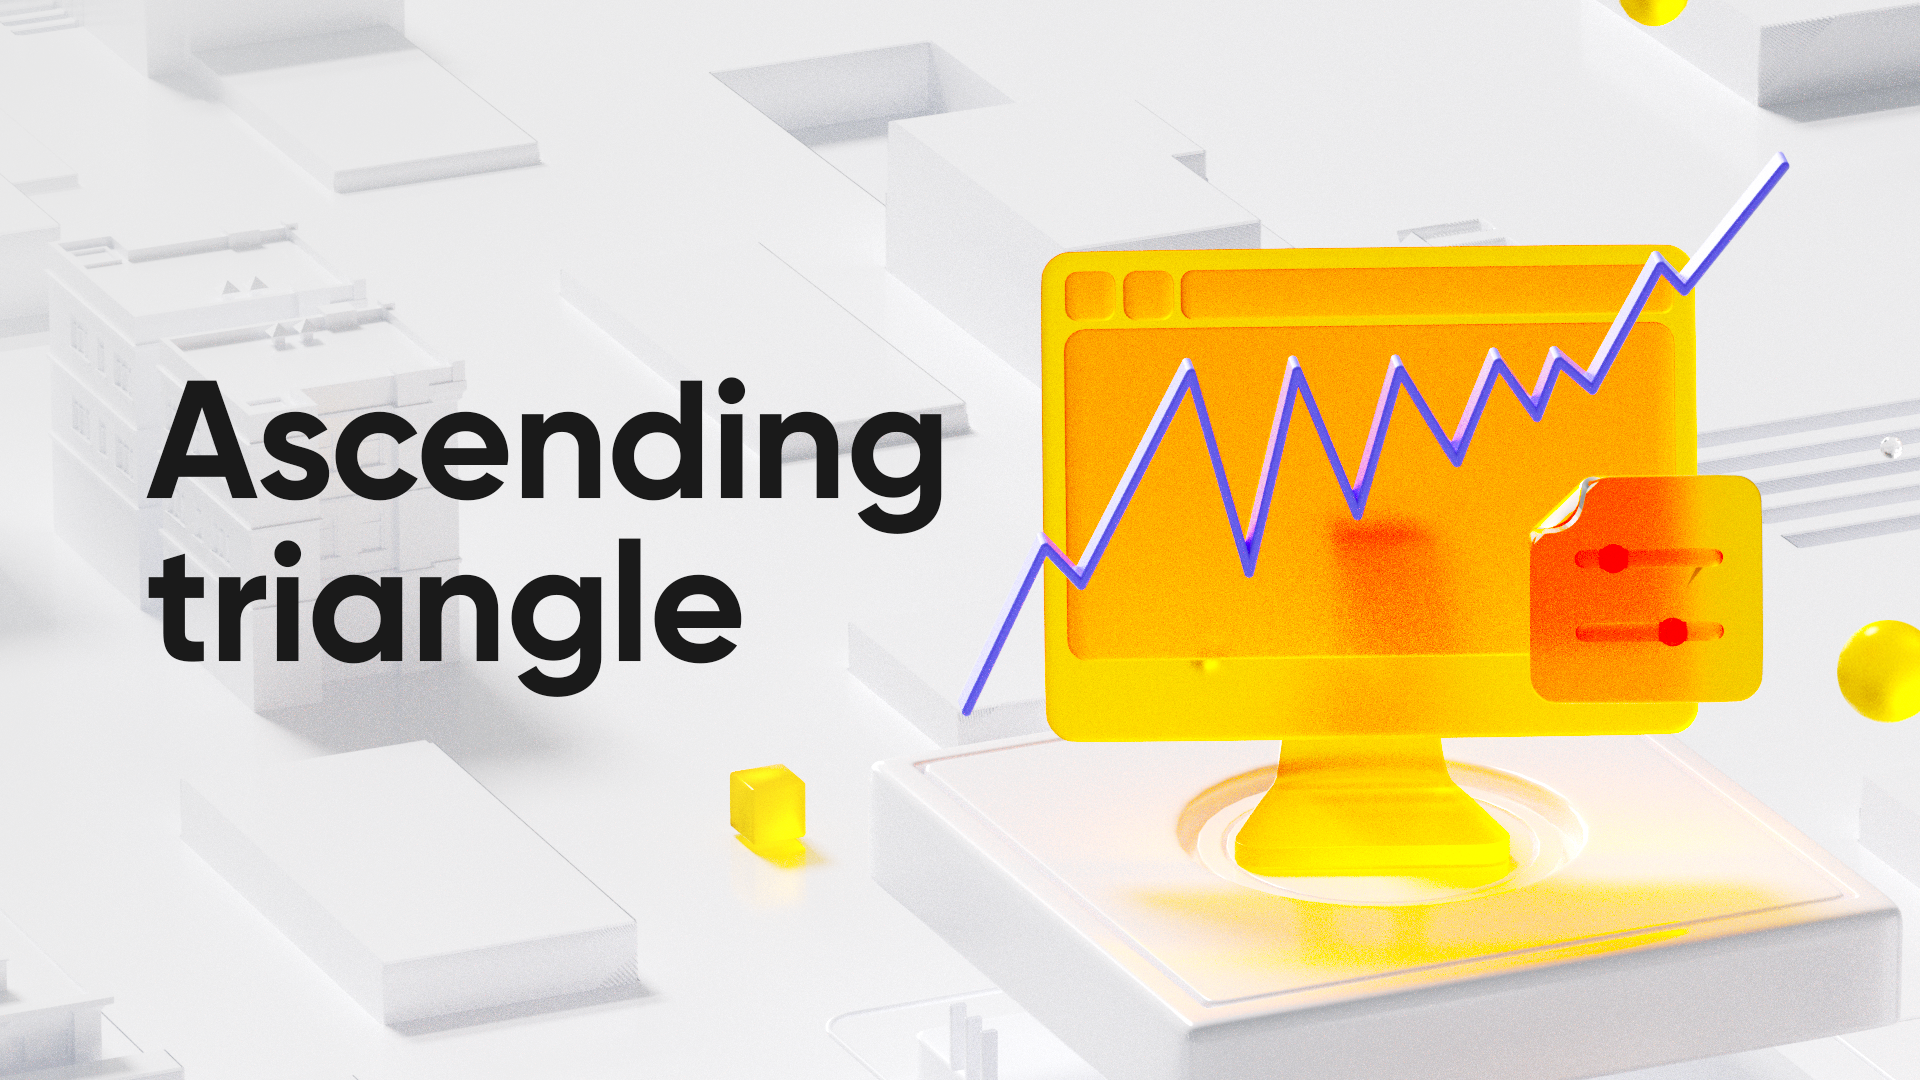
Tigers who select the right chart pattern of Dark Cloud Cover from the following three figures will receive 5 Tiger Coins. (Please comment the photo directly)
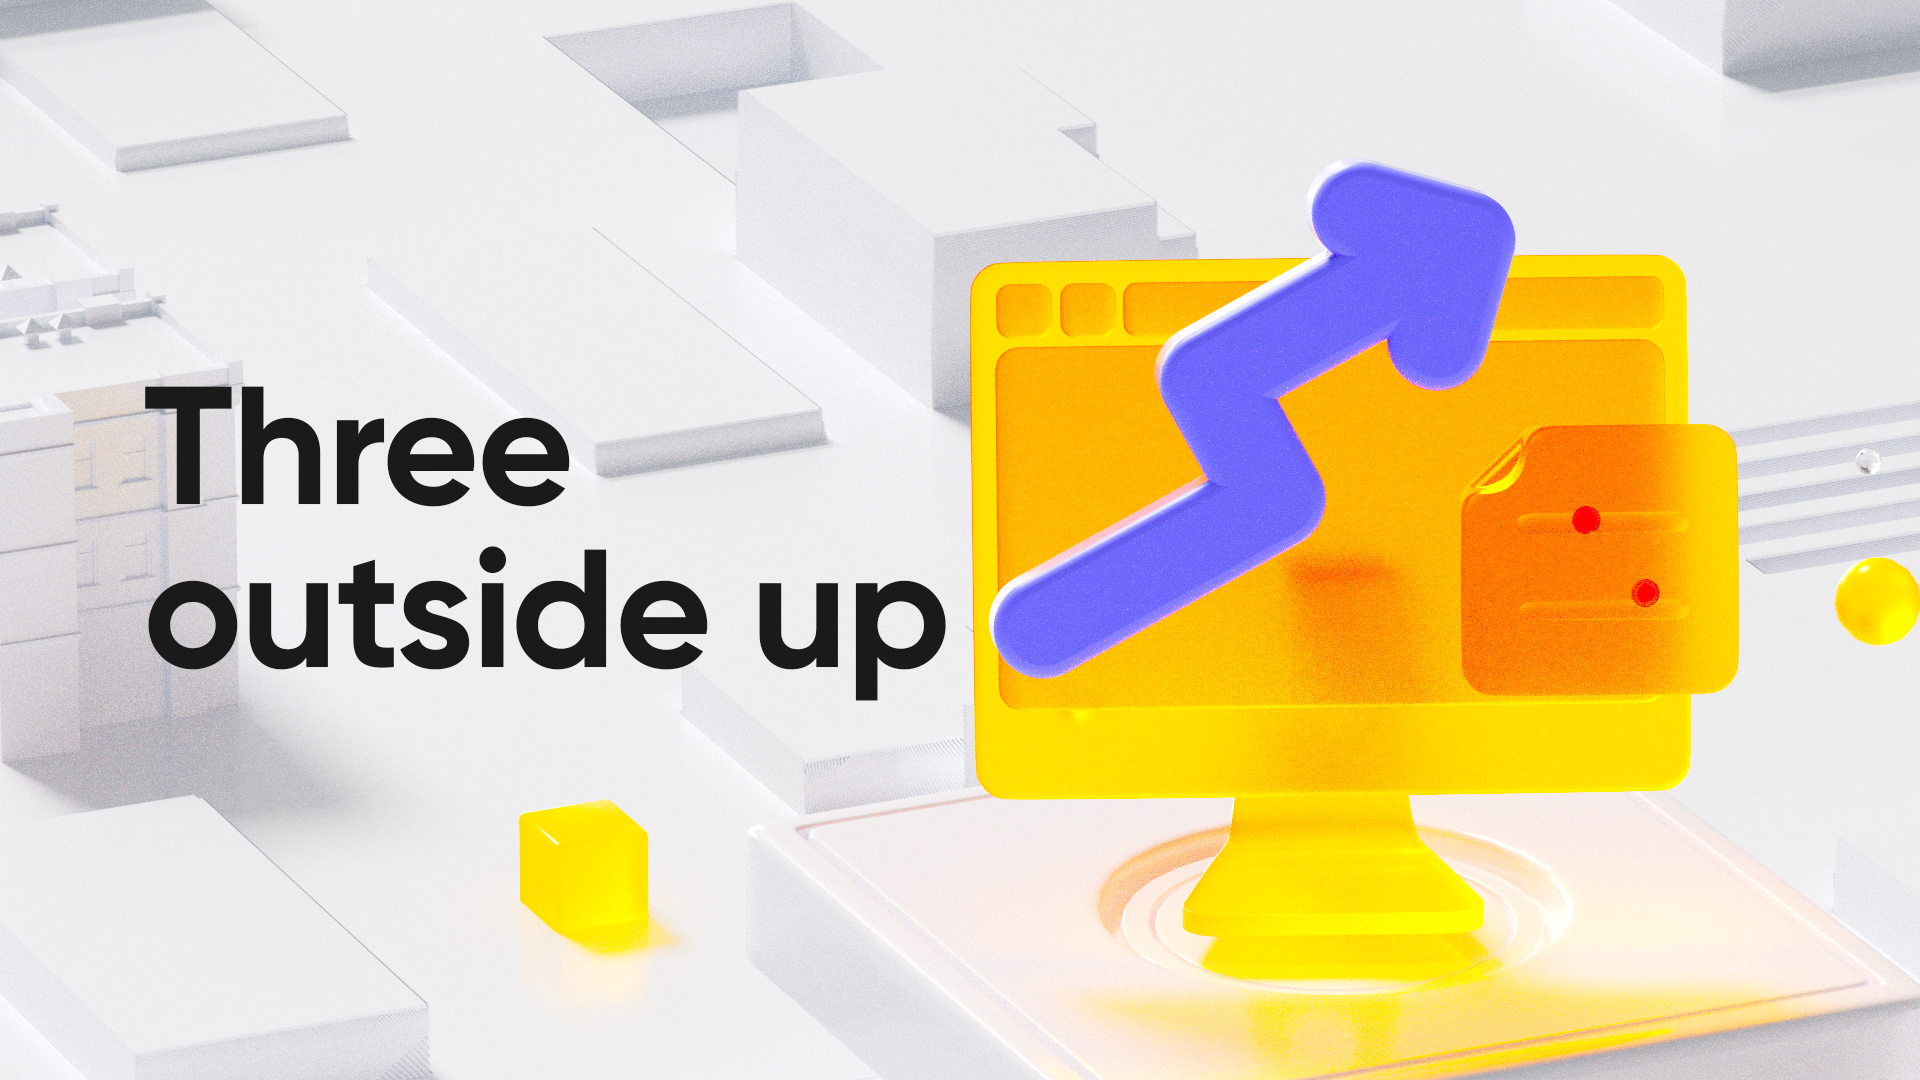
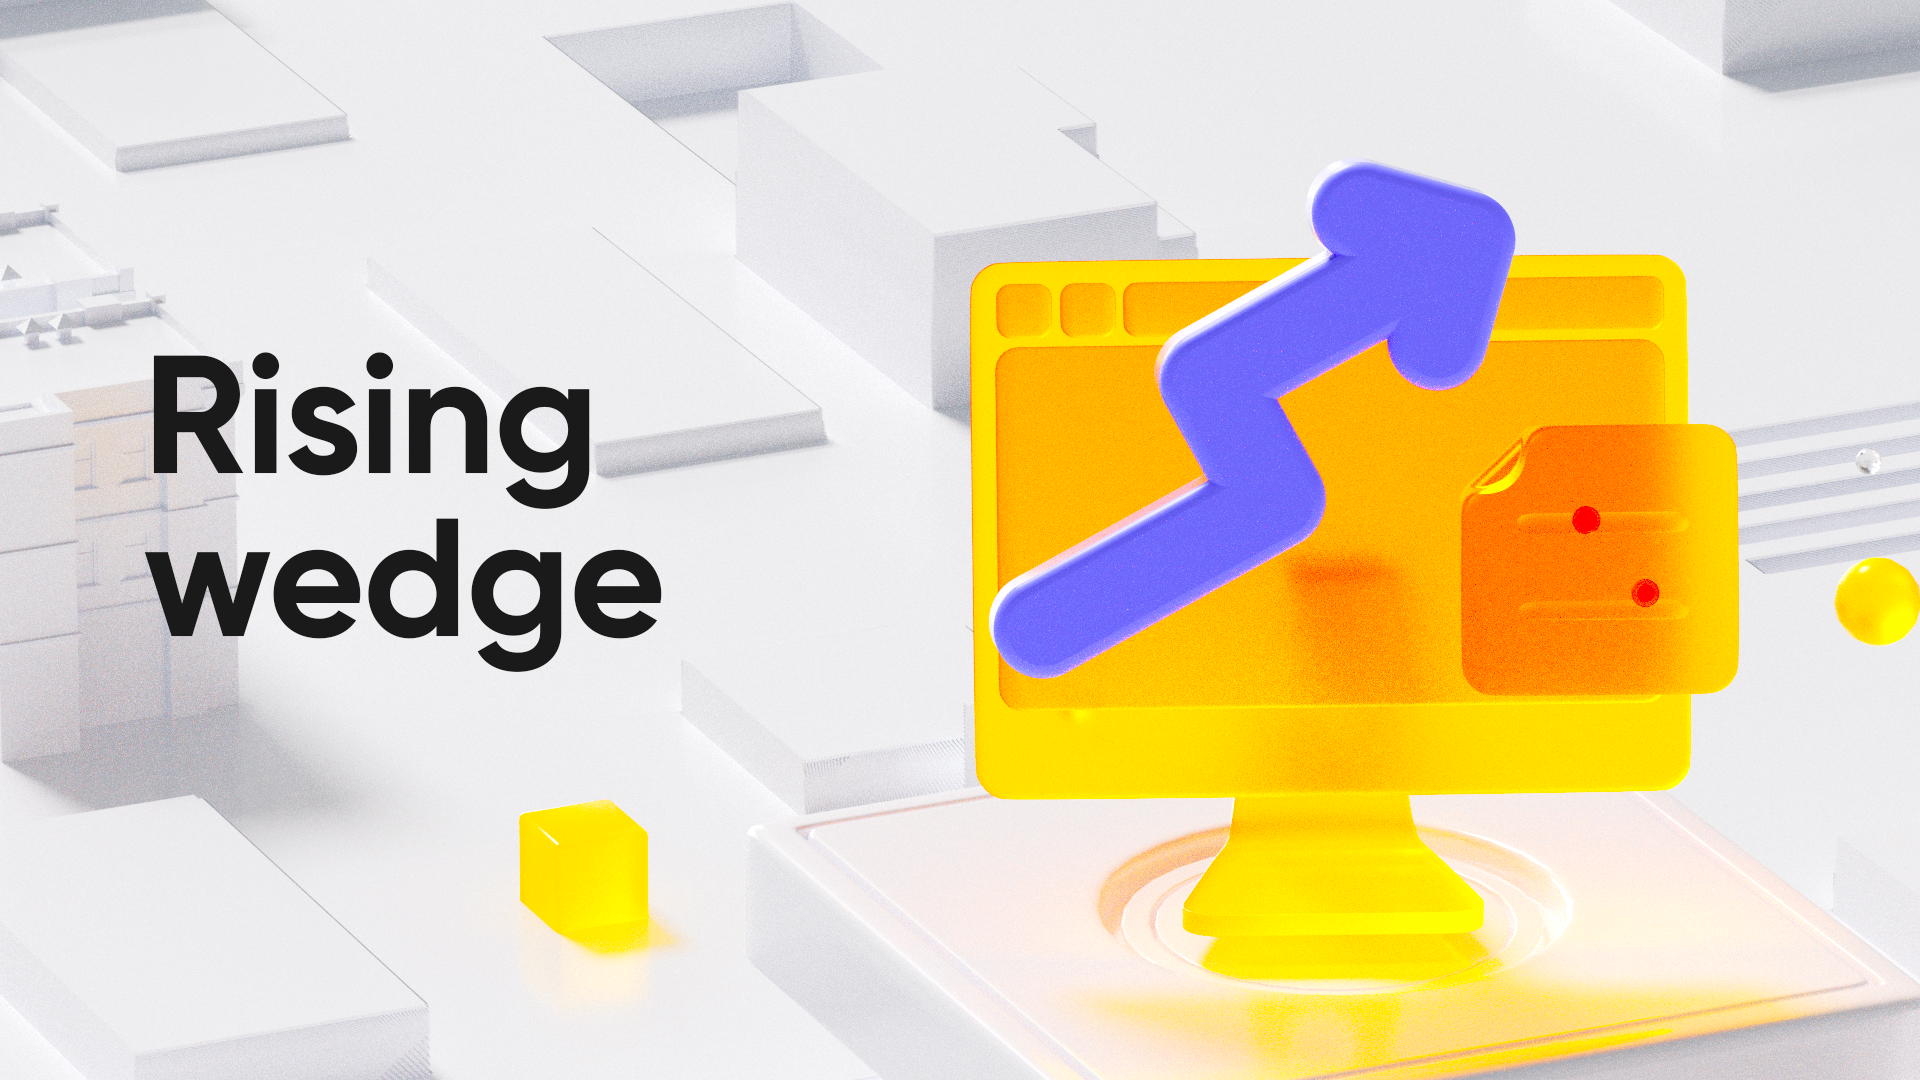
 Figure 1
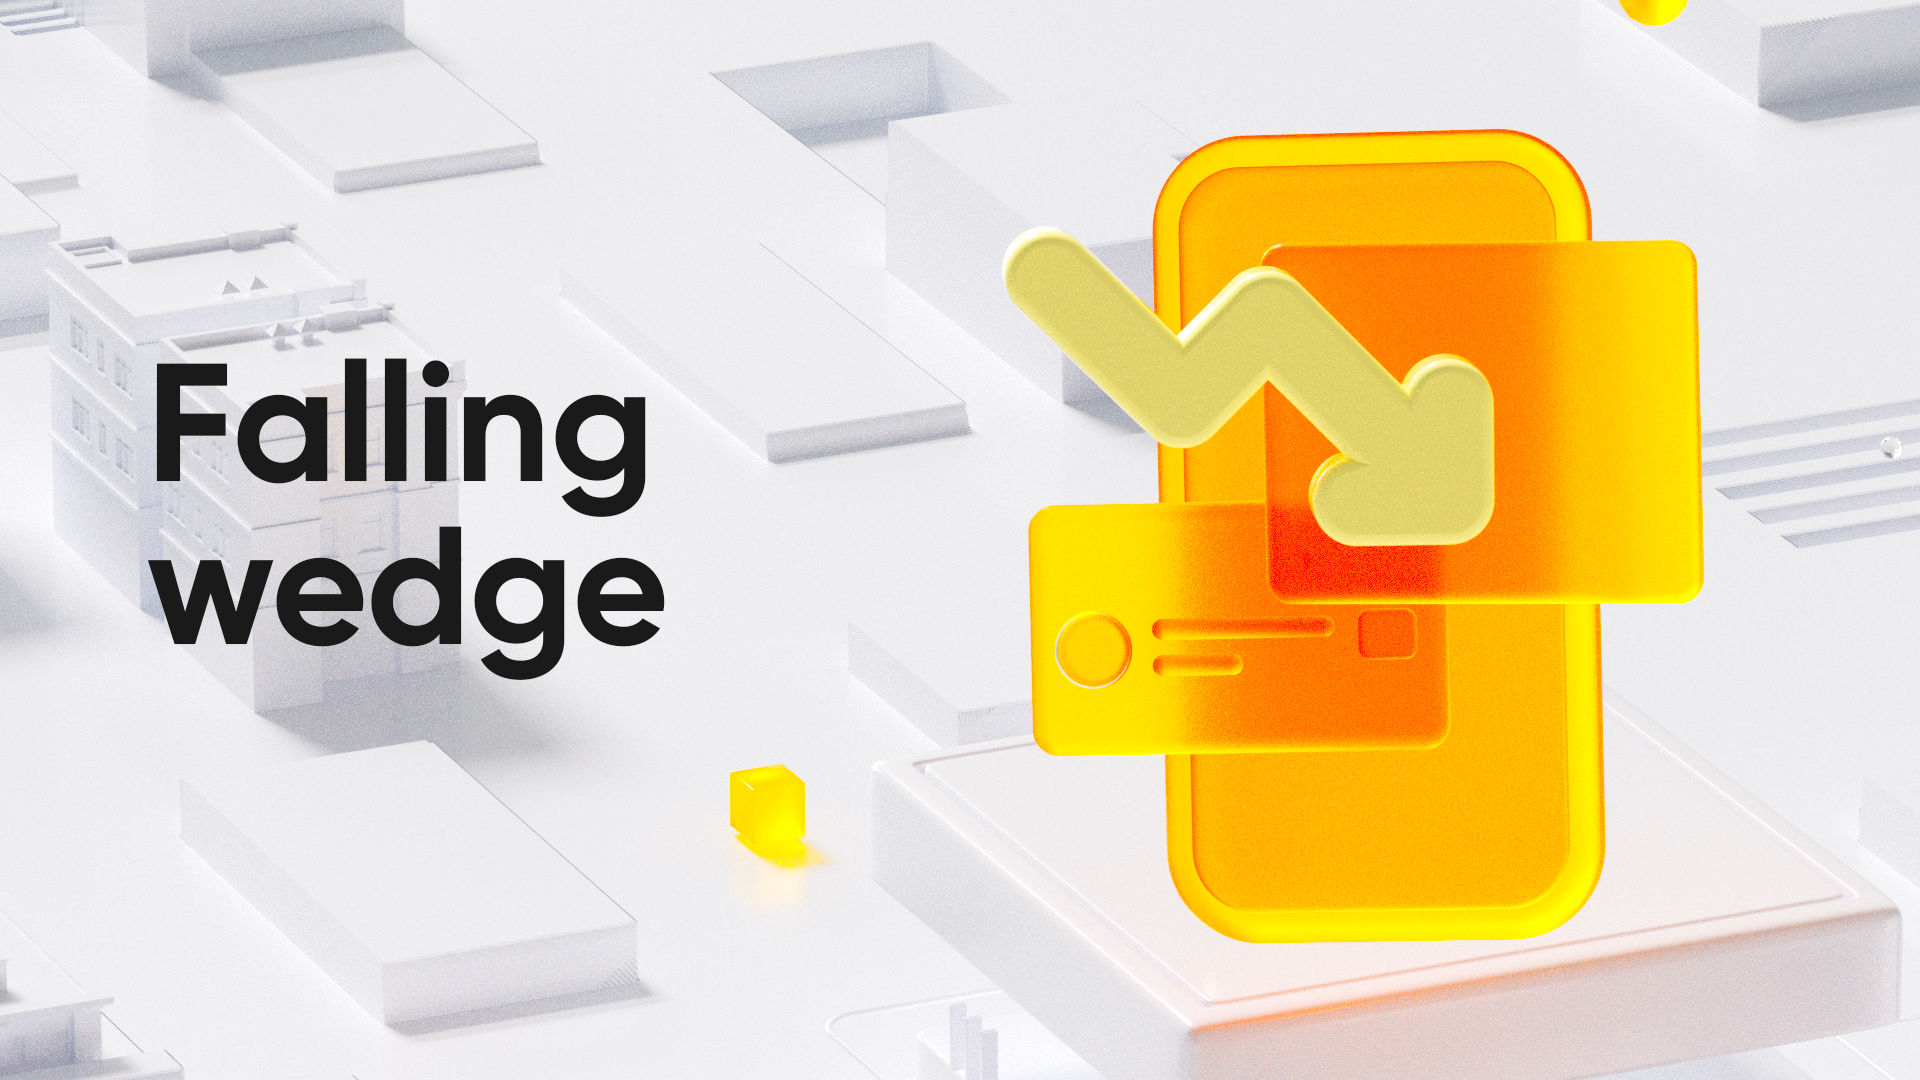
 Figure 2
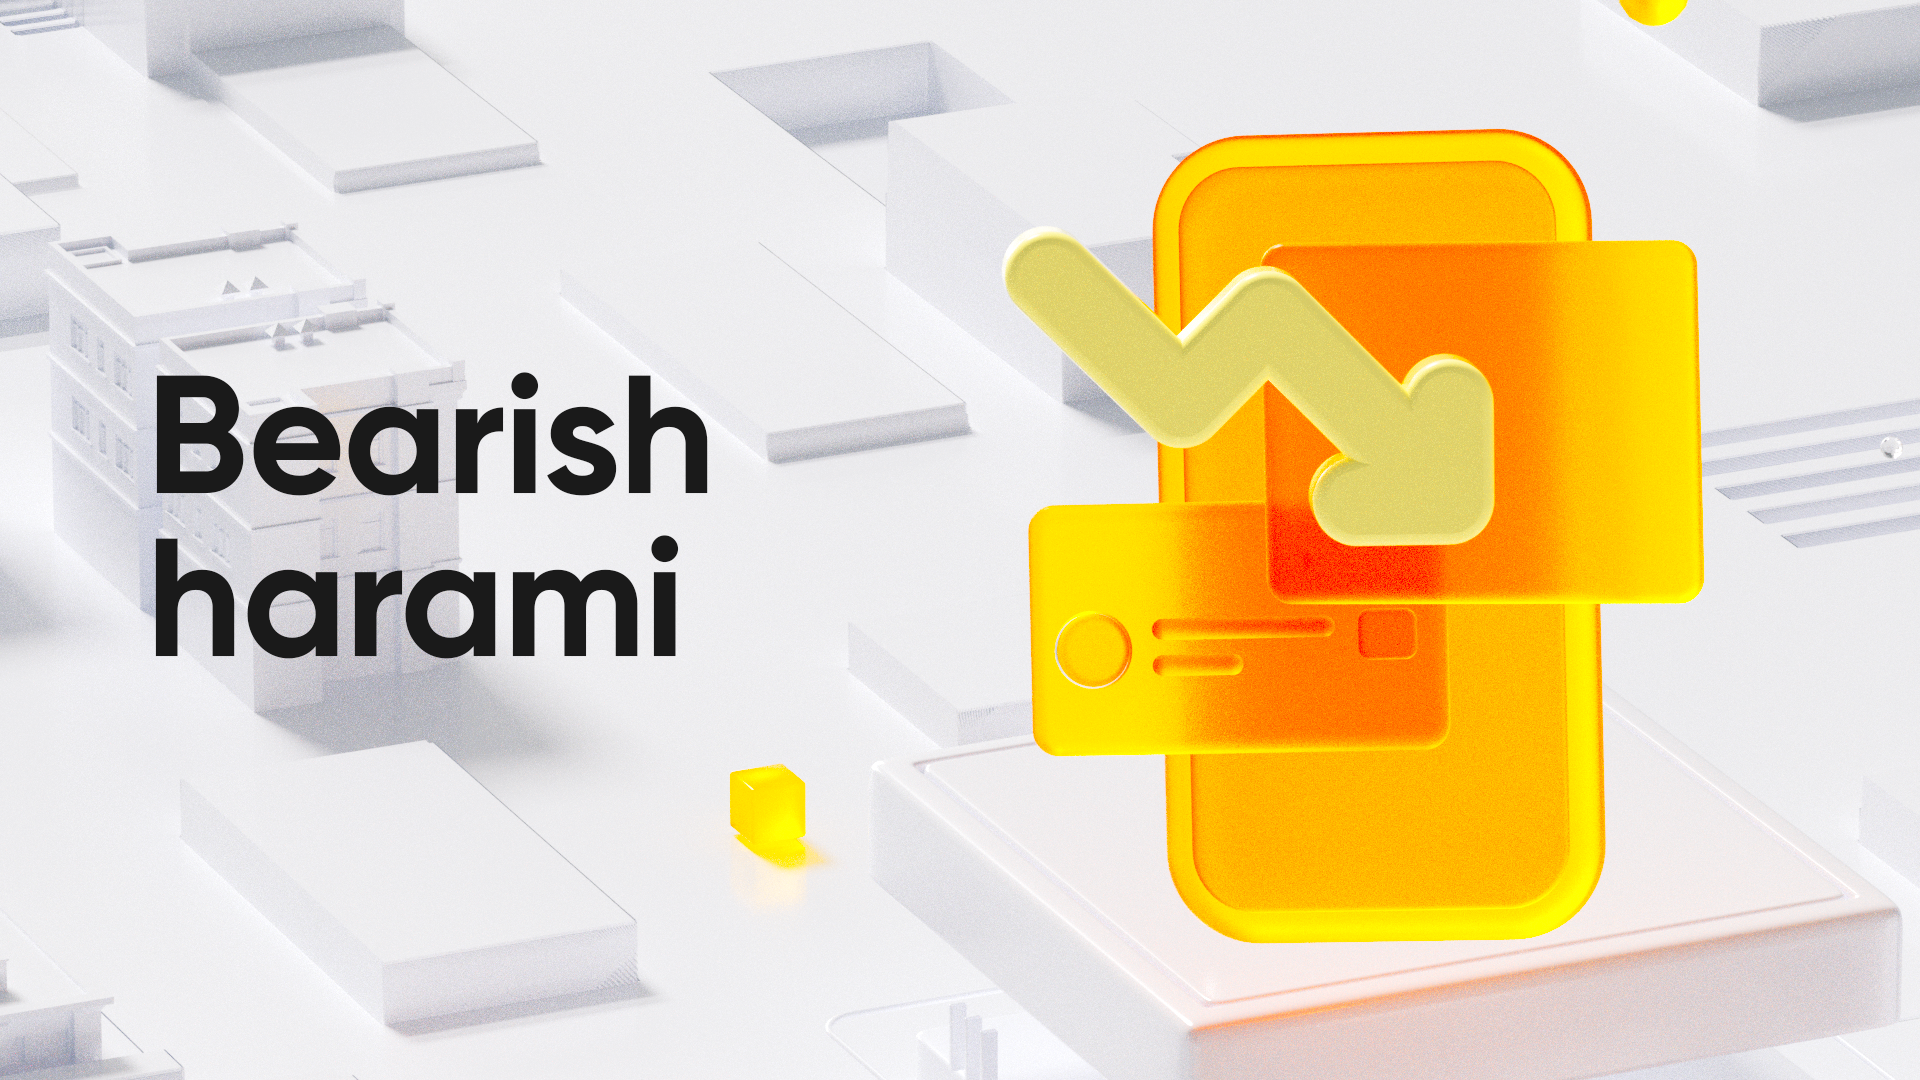
 Figure 3
Tigers who share stocks of chart out of the following options will be rewarded with 10 Tiger Coins.
【Event Duration】
May 26, 2023 to June 2, 2023
In the next issue, we'll introduce another useful technical pattern, Morning Star, which will make your stock trading easier and simpler after you learn it!


Comment(21)