Since U.S. stocks were closed for Labor Day on September 4th, most of the data were released in the last week of August, which made market rebound under multiple favorable conditions.
There are many surprises in the economic data. For example, the core PCE price index in the United States rose by 4.2% year-on-year in July, which was in line with economists' expectations and higher than 4.1% in June.
Although the inflation data was higher than last month, the range was much smaller than expected (compared with the increase of crude oil in August), which strengthened the market's expectation that the Federal Reserve would no longer rate hike. At the same time, the non-agricultural employment data of the United States increased by 187,000 after the quarter adjustment in August, which was significantly higher than the market expectation of an increase of 170,000, and the unemployment rate in August was 3.8%, which was expected to be 3.5%.
These data made the market think that the Federal Reserve will no longer rate hike in the future, which means that the future interest rate cut cycle is not far away. At present, CME's FED Watch Tool tool shows that the probability of no rate hike in September is 94%.


Does the US stock index continue to be bullish?
According to the current fundamental situation, it is necessary to discuss the index separately.
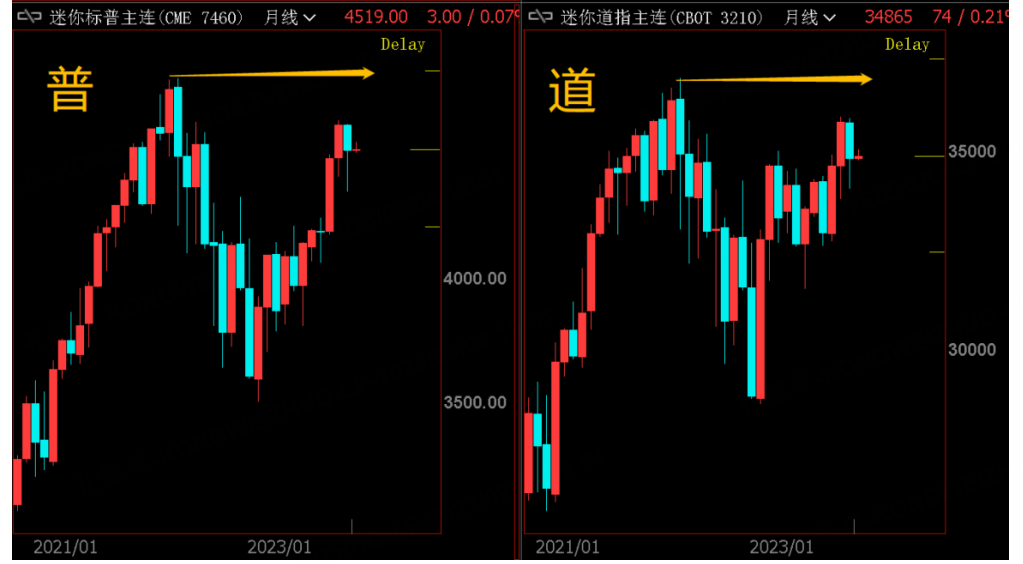
As a U.S. equity weight index, The three major U.S. stock indexes is highly correlated and trading is relatively crowded. Although the U.S. economy may have a "soft landing", it does not mean that it will not have a short-term correction. Therefore, when S&P came to the neckline position of 4370 last week, it was a key node, and the downward breakthrough continued to fall greatly; If you don't break and rebound beyond the 20-day moving average, you will stop short or stop profit. After all, in the current market, data determines the direction.
But if the US economy really has a "soft landing", are there some indexes or stocks undervalued? The answer is yes.
In addition to the three major U.S. stock indexes, there is also a Russell 2000 index futures that can be traded. This Russell 2000 index can be understood as a collection of small and medium-sized stocks in the United States.The index has been weaker than the above three indexes since it fell last year. However, with the possible "soft landing" of the US economy, the small and medium-sized indexes will probably have a rotation effect, which is stronger than the three indexes.

After the non-farm data was released last week, the Russell 2000 index was stronger than the three major indexes, indicating that after the "soft landing", the market preference changed somewhat, and friends who be Bullish on US stocks indexes can consider the Russell 2000 index.
Second, after the breakthrough of crude oil, the bull market will come again?
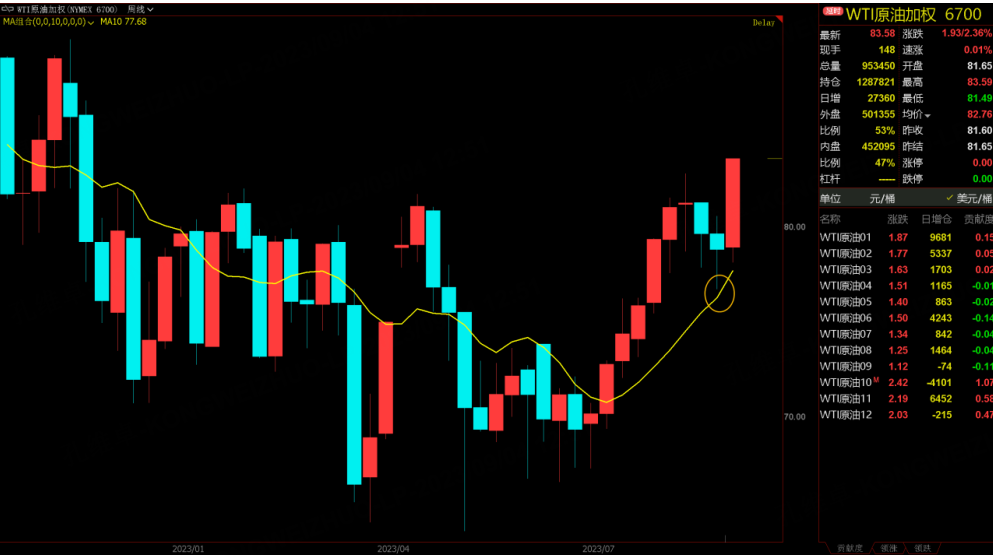
The oil price finally broke through the upper chord of the range of $82, and the trend was relatively strong on the basis of OPEC's continuous extension of production reduction. Since the oil price has broken through and there is no extra negative fundamentals, we should follow the trend and make a good stop loss.
The next key mark for oil prices is $90. Since the average dumping price of US strategic oil reserves is around 96, there will be a strong shock in the oil price around 90 US dollars. However, we are still the old rule, using a moving average to track it.
$NQ100 Index Main Connection 2309 (NQmain) $$SP500 Index Main Connection 2309 (ESmain) $$Dow Jones Main Link 2309 (YMmain) $$Gold Main Connection 2312 (GCmain) $$WTI Crude Oil Main Connection 2310 (CLmain) $
Comments