After the non-farm data, the most important data this week is the CPI data in August, which is also the last data before the Federal Reserve's interest rate meeting in September. At present, the main point of this data lies in whether there are signs of re-acceleration.
As the oil price will rise by 20% in July-August, the gasoline price will also soar. At present, the market predicts that the CPI data in August will rise by 3.6% year-on-year, which is more rebound than the data of 3.2% in July. Once the data exceeds expectations, it will raise the market expectation that the Fed will raise interest rates again before the end of the year, and then the overall market pricing will be affected.

US stock indexes affected by data
The current trend of US stock index is highly correlated with the data, but due to the mixed quality, the rising and slowing rate is in line with expectations. As for whether we can continue to walk the bull or break through the decline, it depends entirely on the horror degree of the data. If it is mediocre, the market will only fluctuate greatly, and there are not many real directions.
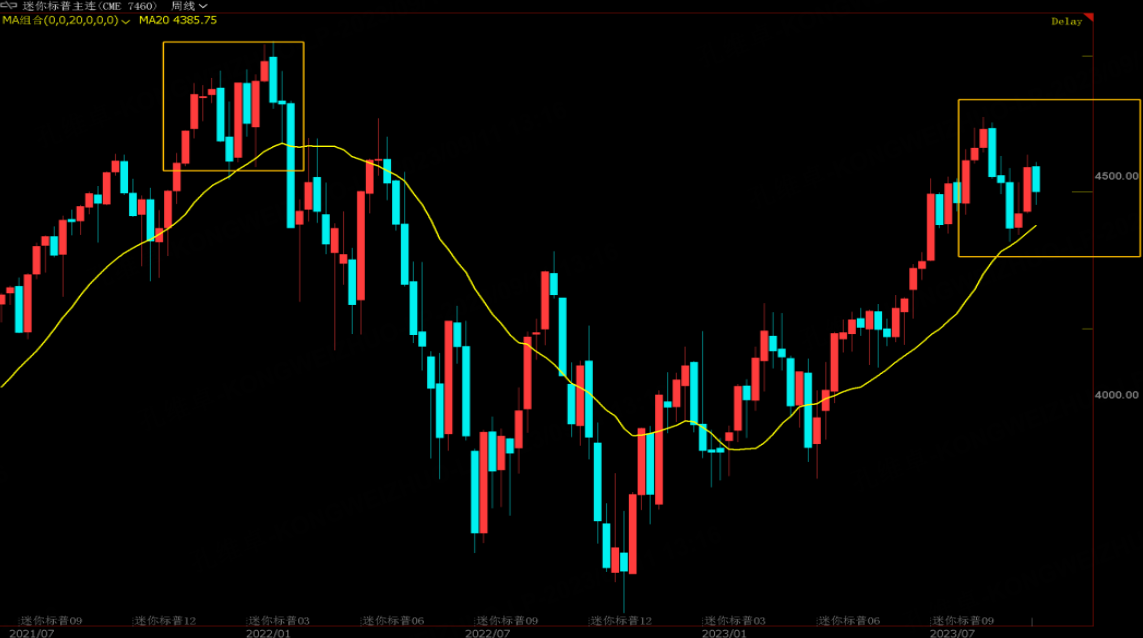
Fundamentals can't give a clear direction, so let's find a breakthrough point in technical analysis. Last week's live class specifically talked about the important technical position of the lower US stock index, which is still above this technical position, and it is still impossible to confirm that the medium-term trend is short.
The 20-week moving average is an important technical watershed for the current US stock index. Around 4370-4400, before and after the release of CPI data this week, it is not excluded that the stock index will rebound sharply after reaching this technical position, depending on the long and short direction given by CPI data.
At the same time, above the 20-week moving average, the trend of the US stock index is similar to the top trend in early 2022. In the case of slowing down the rising speed, we can rely on the 20-week moving average and take this trend as a reference to design short-term trading strategies, so that the trade will be more profitable than a single direction.
Can crude oil continue to rise?
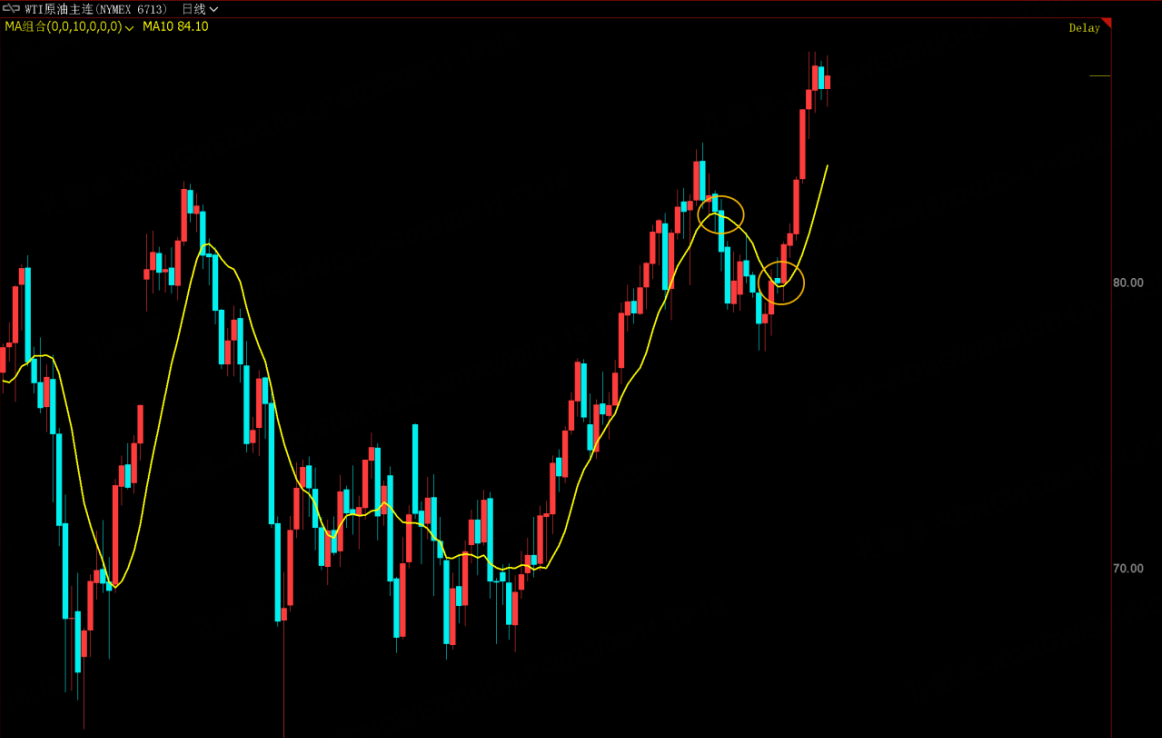
Thursday night's live broadcast will talk to you about the overall trend of bulk commodities, and the most concerned thing at present is the situation of energy prices. Driven by the joint production reduction of Russia, crude oil continues to rise. However, because the domestic crude oil production in the United States has not increased significantly, and the United States can no longer sell a large amount of strategic oil reserves to suppress oil prices, the fundamentals of crude oil are not at all bad at present, so shorting crude oil will be psychologically uncomfortable, and it is not recommended that everyone try it easily.
But how much more can oil prices rise? Can you break 100?If you add a longer dimension (2-3 years), this is not difficult. But whether it can break 100 in the short term depends on whether Russia can cut production more cruelly. Now that the oil price trend has appeared, we can trade with the trend. As long as the logic of production reduction no longer holds (it is impossible to reduce production indefinitely), the oil price will still fall beyond everyone's expectation. As for the current oil price, we can re-track the 20-day moving average for long-term trading, which is a safe approach.
$NQ100 Index Main Connection 2312 (NQmain) $$Dow Jones Main Connection 2312 (YMmain) $$SP500 Index Main Connection 2312 (ESmain) $$Gold Main Connection 2312 (GCmain) $
Comments