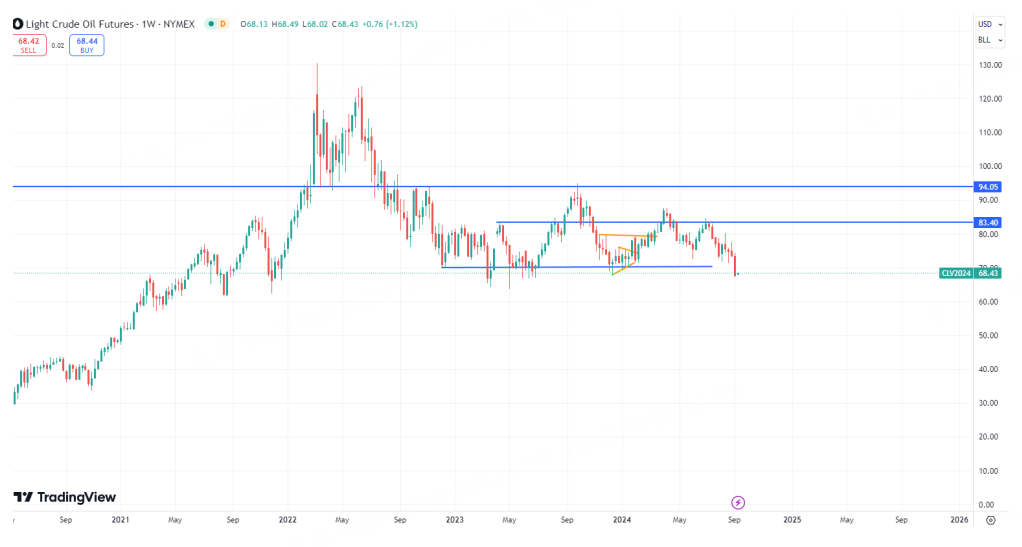
Oil prices have fallen below the $70 level for the first time since the end of last year.
Although they have not yet broken through the low support of nearly two years, their vigilant effect cannot be ignored. Coupled with the fact that the yen has not shown signs of returning to weakness, we may still have to make some preparations for tail risks.
As we all know, crude oil, as the king of commodities, has long been highly correlated with the economy. Although under the control of the Biden administration, oil prices have become a range-bound variety in the past two years, but the market cannot run within a range forever. With the new president on the horizon, this kind of breakthrough will come sooner or later. However, if it breaks down before the general election, it may have different representative meanings.
As we said before, the most likely situation is to maintain sideways trading and maintain the trend until the election results are released. If there is a short squeeze in risky assets (mainly U.S. stocks and those benchmark AI stocks), it means that the Democratic Party is digging holes and surrendering.
Then, if you think about it on the other hand, if the pattern of first falling and then rising, does it mean that Trump's chances will be greatly reduced? According to the current poll data, the Democratic Party and the Republican Party are still in a close situation, but smart money must exist earlier than the public's expectation.
Back to the oil price itself, the next key support is at the low of 63.64, followed by the previous intensive long-short turnover area of $60. Judging from the recent structure of the weekly line, there is no doubt that bargain-hunting is a contrarian behavior, especially last week's negative line entity is quite obvious. But from the perspective of profit-loss ratio and small gambling pleasure, the current price is also attractive to a certain extent. Then, it is safer to wait for a single K-line signal that bottoms out on the weekly line, or a signal/combination that reverses the transformation on the daily line, and then try.
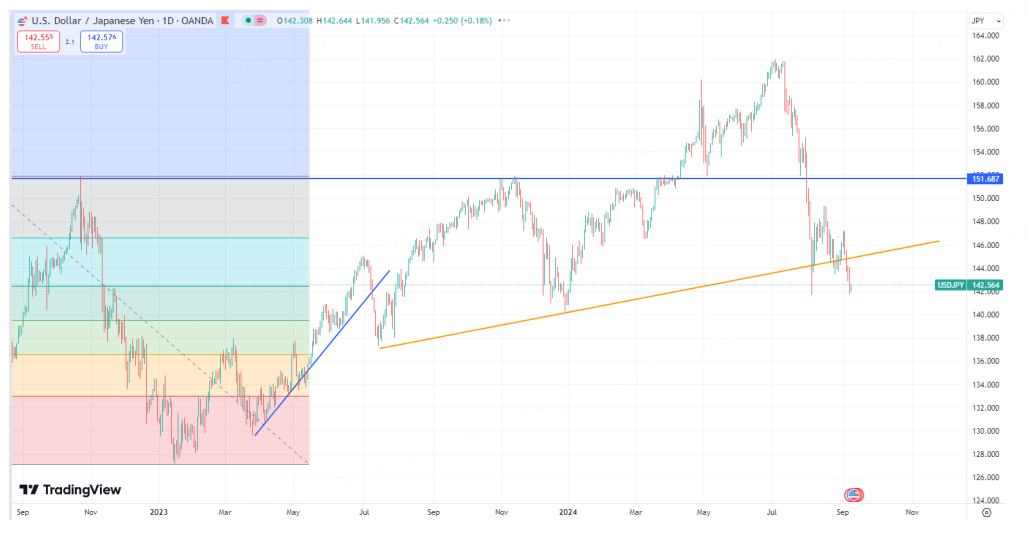
Another leading indicator is the yen we talked about before. Return of arbitrage/carry funds = rebound of yen = decline of risky assets. A low point set by USD/JPY in August has been tested again, and a break will mean the strengthening of the short-term trend and the risk of further exploring 137/136. In this case, risky assets, including crude oil, will obviously face greater downward pressure.
In terms of technical trend, similar to oil prices, the exchange rate last week was also an obvious mid-yin line + bearish swallowing combination. This implies that it is significantly more difficult to continue to fall than to reverse and go higher. Of course, considering the upcoming FOMC next week, there is also an opportunity for the bad news to become bullish after the boots land. But at present, it is obvious that we cannot rush to buy bottoms and do more in the United States and Japan. It is safer to wait for one more week after the market is really sure to stabilize and reverse before considering it.
Taken together, both leading indicators are currently on the eve of accelerating breakout. Although there is no real breakthrough, and there are variables in the news, we still have to be alert to the acceleration of the market. Once both indicators provide clear bearish signals, then on the risk asset side, it is still necessary to decisively lighten/close long positions to avoid a sharp shrinkage in profits caused by black swan/tail risks.
$NQ100 Index Main 2409 (NQmain) $$Dow Jones Index Main 2409 (YMmain) $$SP500 Index Main 2409 (ESmain) $$Gold Main 2412 (GCmain) $$WTI Crude Oil Main 2410 (CLmain) $


Comments
好