First of all, I think we are now in a rare bear market of US stocks, and there is no doubt about it.
In fact, the trend of the market is very regular. When most people think that the U.S. stock market plunged off guard, we will find that this is only an essential one in the routine correction of the U.S. stock market.
You can attribute the plunge to the soaring inflation, the Fed's interest rate hike, or the Ukrainian-Russian war, but in the final analysis, it is time for the correction of US stocks:
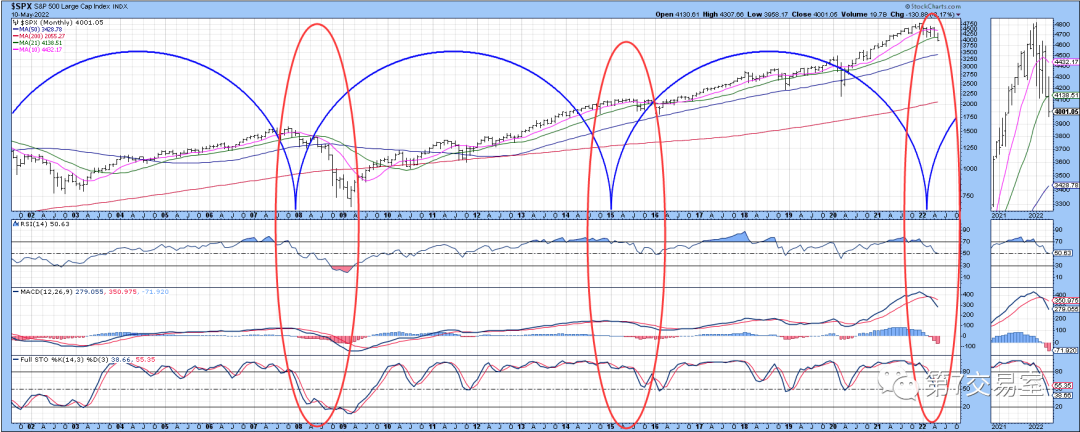
Judging from the trading strength indicators RSI and STO of the S&P monthly line,The adjustment cycle is every seven years, and the correction range of the trading strength indicators this time is even higher than the great crash caused by the pandemic in early 2020.
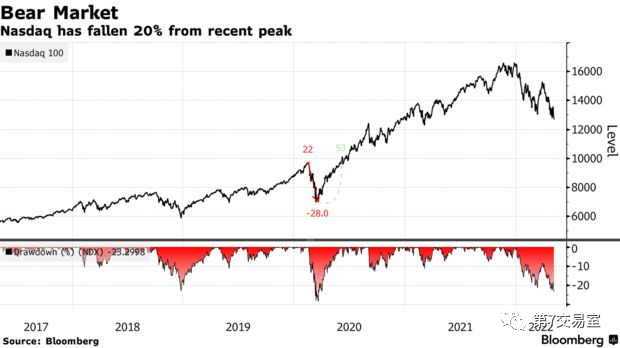
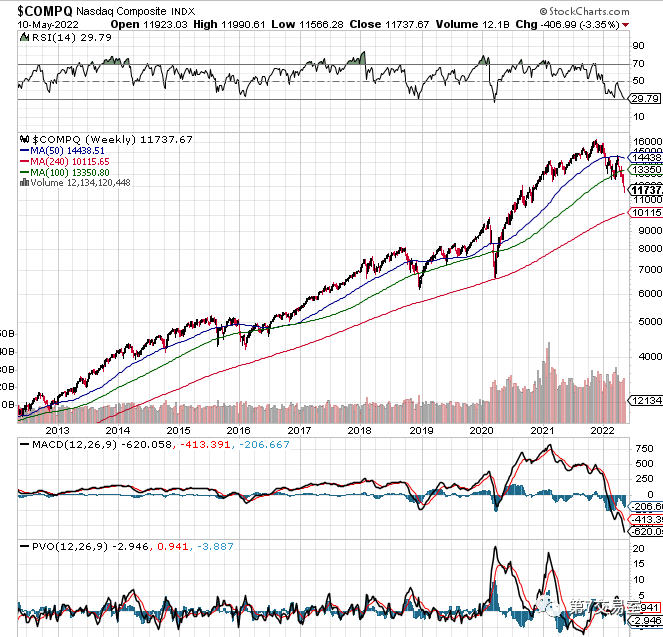
However, in terms of the correction range of US stocks, this cyclical correction is far less than the stock market crash in 2020. Looking at the crash of Nasdaq, it has dropped by 20% from the top,there might be more room for the Nasdaq down
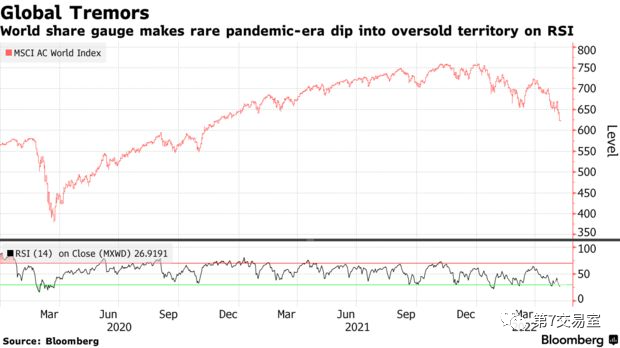
MSCI Global Stock Market Index also fell by 20 percentage points, and RIS Index came to the oversold range. However, compared with the decline of RIS in 2020, there may be room for this position to go down.
Taking the crash in 2020 as a reference does not mean that the decline of stock index will repeat the historical crash, but that the correction space and time of RSI and STO should be no less than that of the crash two years ago,
Market sentiment is extremely pessimistic
But the bottom of the market is not far
For US stocks, it should be the darkest time before dawn now. We believe that US stocks will probably have a chance to rebound in the short term, but in the long run, the bear market may just begin.According to the routine of US stocks, the duration of bull market is usually five times that of bear market. According to this rule, it is appropriate to expect the correction of US stocks to take five to six months.
As we all know, the outbreak of inflation caused by the Ukrainian-Russian War forced the Federal Reserve to raise interest rates sharply. The rise of interest rates put pressure on the high valuation of US stocks, and the soaring inflation also impacted the entity of economic profits. Therefore, this major adjustment cannot be simply compared with the retracement caused by the interest rate rise in 2015.
Let's estimate together today, where is the bottom after the US stock market plunge
First of all, from the economic fundamentals,
We have‘t seen any signs of improvement yet.
The first quarter earnings report is coming to an end. At present, the companies that have released reports account for 89% of the total number of S&P constituent stocks. Obviously, the data is not good.
This is the overall situation of BofA's statistics on S&P Q1 report data
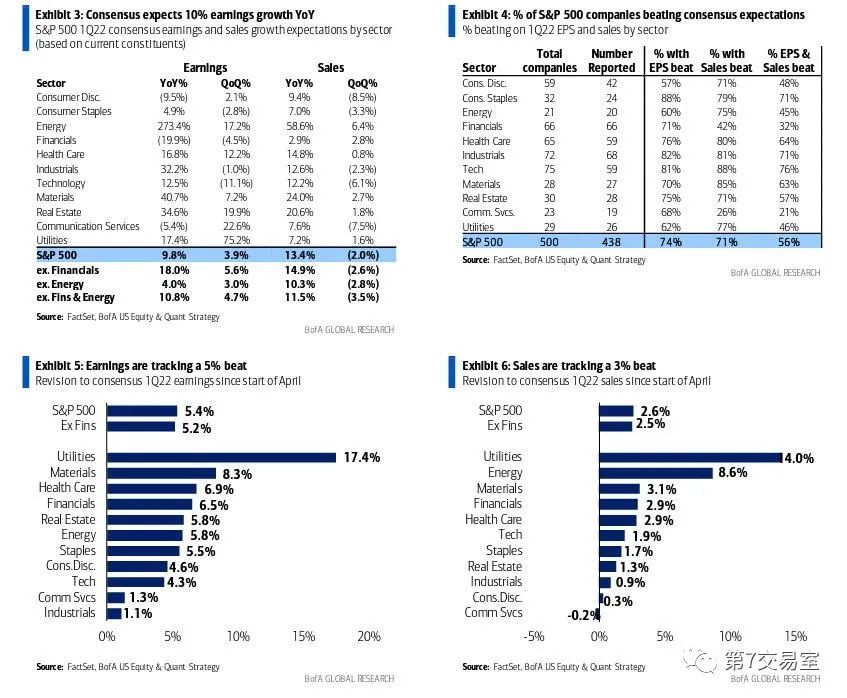
At present, the average earnings per share of S&P in the first quarter increased by 5.4% compared with April. Before that, the expected increase was 3.9%, and the result seemed to be good. Especially in terms of sales growth, it is expected that sales will fall by 2% month-on-month, but as of the statistics date, the sales increased by 2.6% month-on-month, and 56% of companies are ahead of expectations, but don't jump to conclusions,,
If you count the revenue growth from the beginning of this year to the present, you will find that , the revenue growth of S&P was only 2.9%, among which the revenue growth of energy enterprises was the largest, with 62 percentage points, and the profit almost doubled.
If we run the trend chart of year-on-year net income growth for S&P and the energy sector since 1986, we will find that S&P's net growth is stagnant at present, while the profit of the energy sector has been soaring, reaching the biggest year-on-year increase in more than 10 years
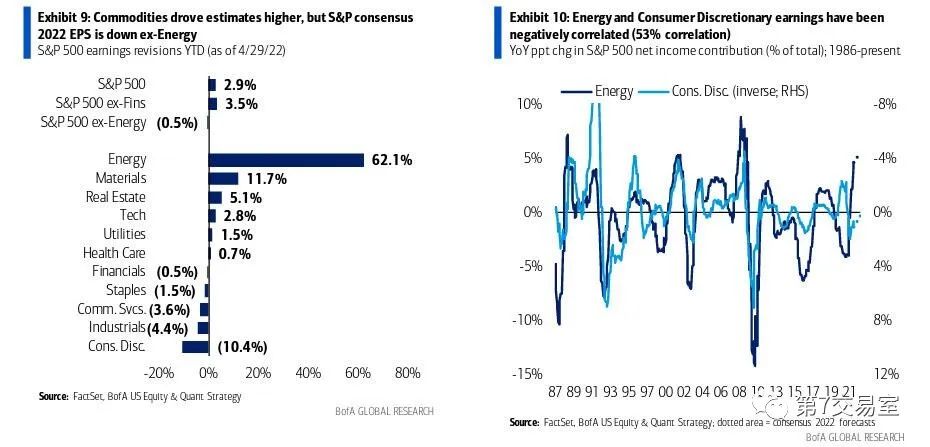
This shows that under the pressure of inflation, the profit of S&P enterprises is stalling, and the illusion of overall growth is mostly provided by energy stocks. It is no wonder that Buffett has been buying oil stocks, because in the long run, the valuation of energy targets is relatively low, and this abnormal situation may last for a long time.
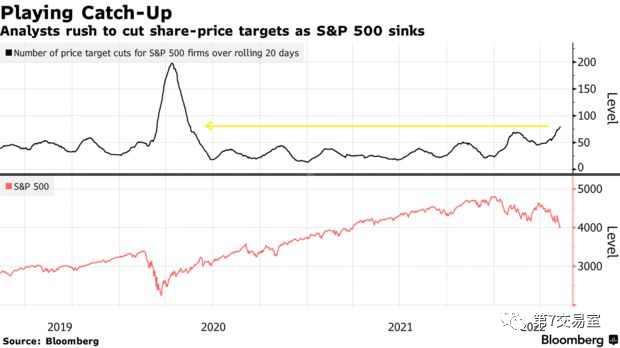
Second, Wall Street has increasingly cut its future stock target prices in the current climate of soaring inflation
The downward correction of the target price is the largest downward correction in the past 20 years except for the first year of the outbreak of virus.
This information comes from fundamentals,
Let's look at the flow of funds.
As we mentioned at the beginning, now is the darkest time for US stocks.
Goldman Sachs' "Sentiment Indicators" are a combination of long and short positions in the stocks and futures of retail investors, institutions and foreign investors. This indicator swings between +1 and-1, exceeding +1 or exceeding-1, which means that the market will be extremely optimistic and extremely pessimistic.
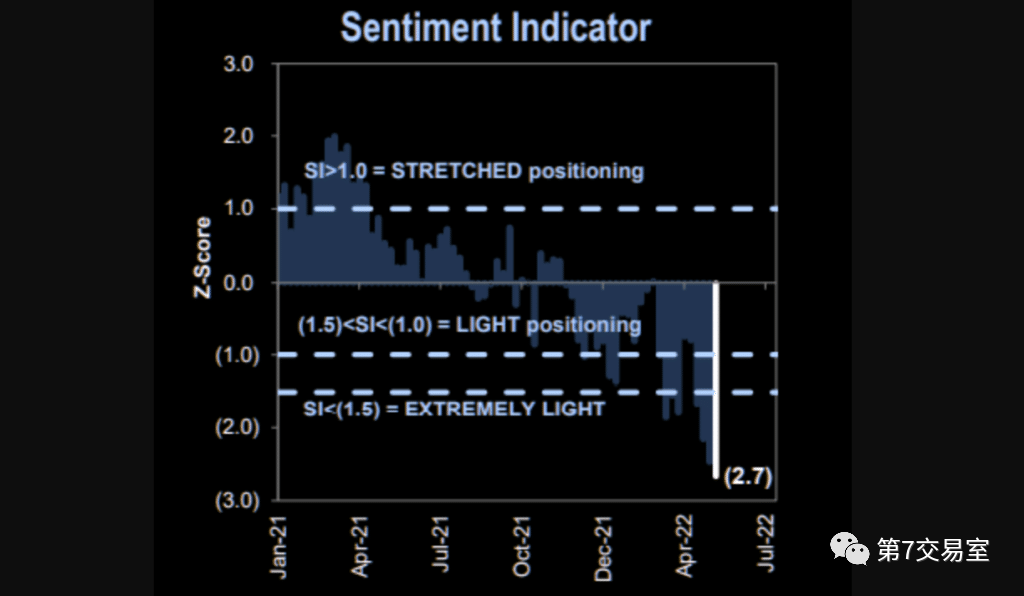
At the beginning of 2021, the Federal Reserve implemented unlimited QE to rescue the market, and the market sentiment index once rushed to the position of 2, but now, the sentiment of US stocks is-2. 7, which is the lowest reading in the past two years.
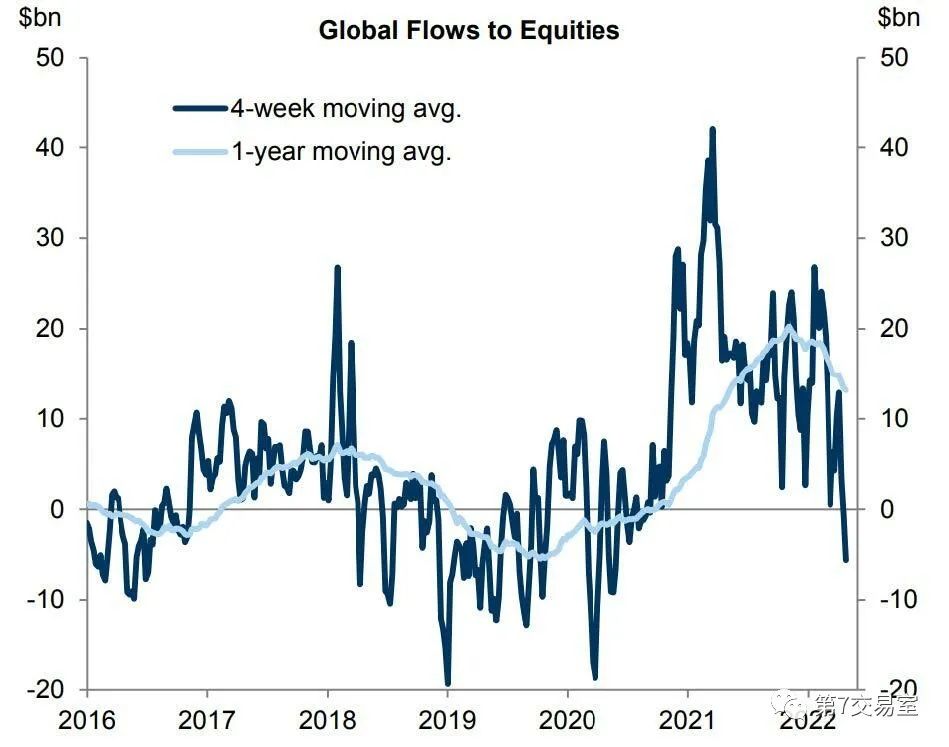
With the decline of US stocks, the global bond market and stock market funds flowed out at the same time, and the net inflow of stock bond funds has reached the lowest period in more than two years:
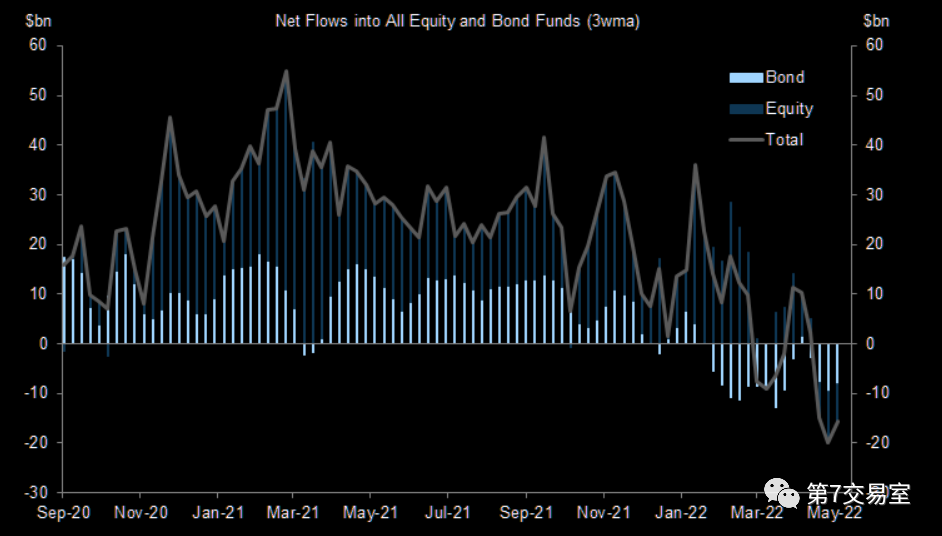
According to Goldman Sachs the index of global capital inflow into equity funds has been greatly reduced, and the 4-week moving average has fallen below the zero axis.
From the previous trend, every time it falls below the zero axis, it is often accompanied by the trend of bottoming and grinding for half a year or even longer
Professional investors are also extremely pessimistic. The four-week moving average of the National Association of Investment Managers bullish index has just plummeted for three consecutive weeks in recent days, and it seems that it is about to bottom out.
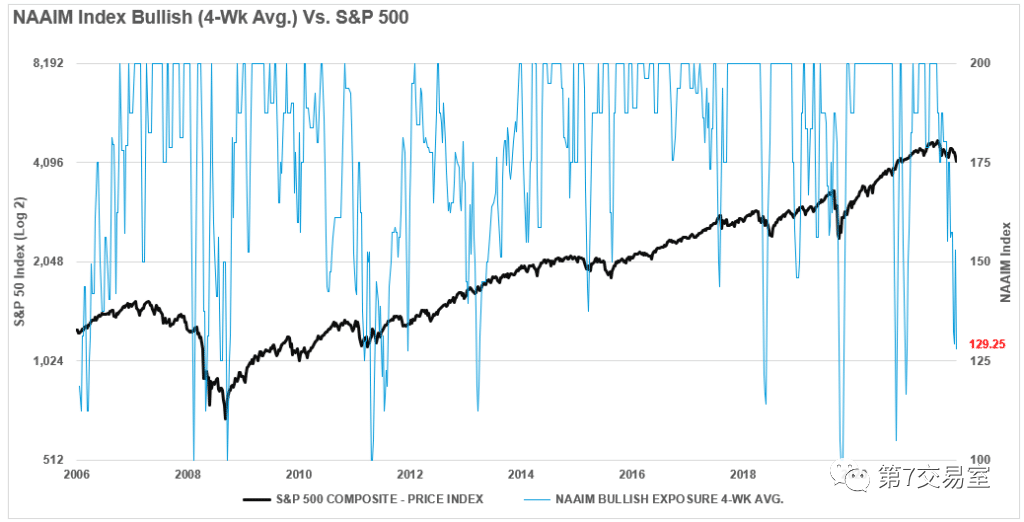
The darkest period usually means bottoming out, and several key indicators seem to have reached the lowest stage. Does it mean that the bottoming out of US stocks is not far away?
How long will the bear market last? What position should we pay attention?
October is the most mentioned time point in the current analysis from Wall Street. This time point is generally considered to usher in the reversal moment of US stocks. Before that, US stocks will have a high probability of making a big shock and bottoming. As far as the current position is concerned, US stocks should not have bottomed out yet.
Let's take out an old chart shared six months ago and look at the callback point of S&P on the long-term technical side
After breaking 4000, S&P has little decent support, and the free landing movement on the stock price is heading out to 3700 points。 Then you can look around 3400.
As for the Nasdaq, it has completely fallen below the 100-week moving average and is moving towards the 240-week moving average. This point is around 10,000 points, which is just the peak of the long-term crash in 2020. If you are not wrong, this point is a very critical node. We must pay attention to it.
$NQmain(NQmain)$ $YMmain(YMmain)$ $ESmain(ESmain)$
But in the short and medium term,
There may be a chance for US stocks to rebound
Because the RIS index decline of the above two indexes has begun to slow down.
First of all, the negative impact of rising interest rates is decreasing, and the yield of US bonds is peaking. If the core CPI is proved to have fallen for three consecutive times, it is basically certain that the top of the yield of US bonds will soon reach.
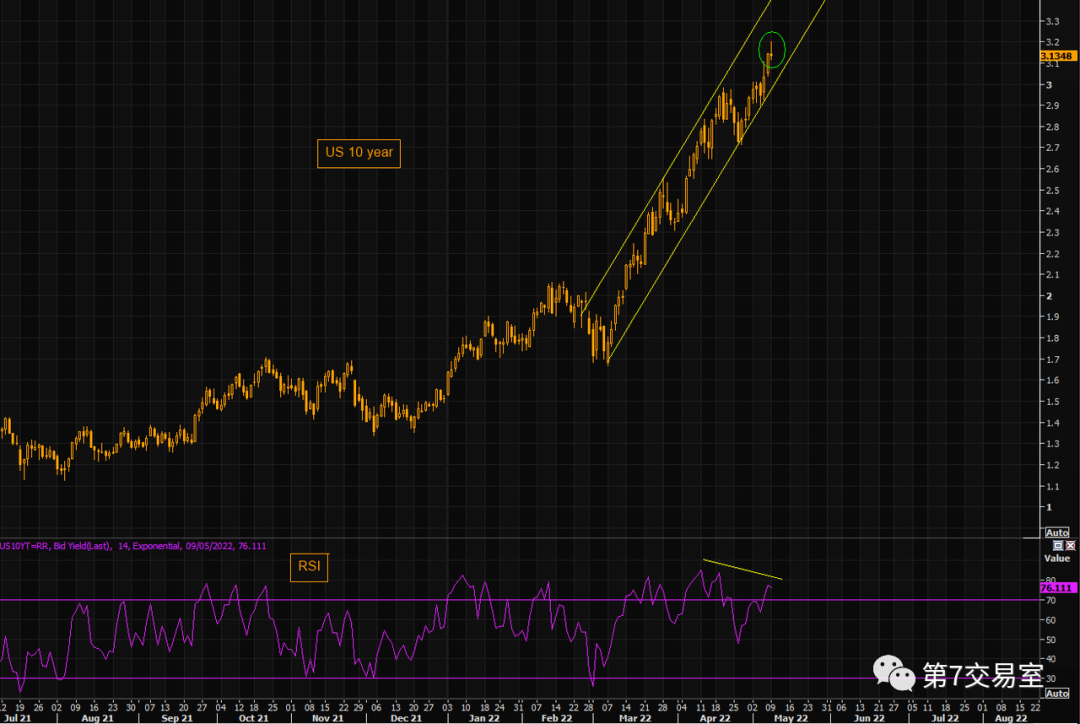
Although the yield of 10-year US bonds keeps hitting new highs in a rather steep rising channel, it should be noted that the range and time are passivating. Secondly, the trend of US bond yield in 10 years has deviated from its RSI, indicating that the decline of yield may be just around the corner.
It seems that the Fed is still consciously controlling the yield structure and trying not to let it show signs of recession.
Therefore, when the big fundamentals are stabilized, the next step is the free movement of US stocks themselves, because from the expectation, the bad news of US stocks may have been exhausted, and now it is the process of digestion. What we have to do is to wait for the market to complete the last fall.
When the US stock market hit a double dip, the VIX index did not break the position and rose, indicating that the panic stabilized
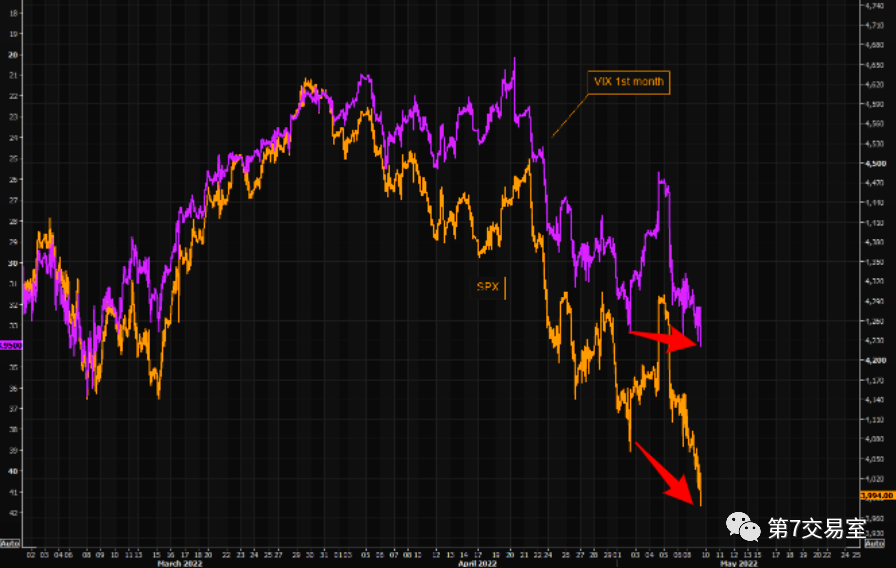
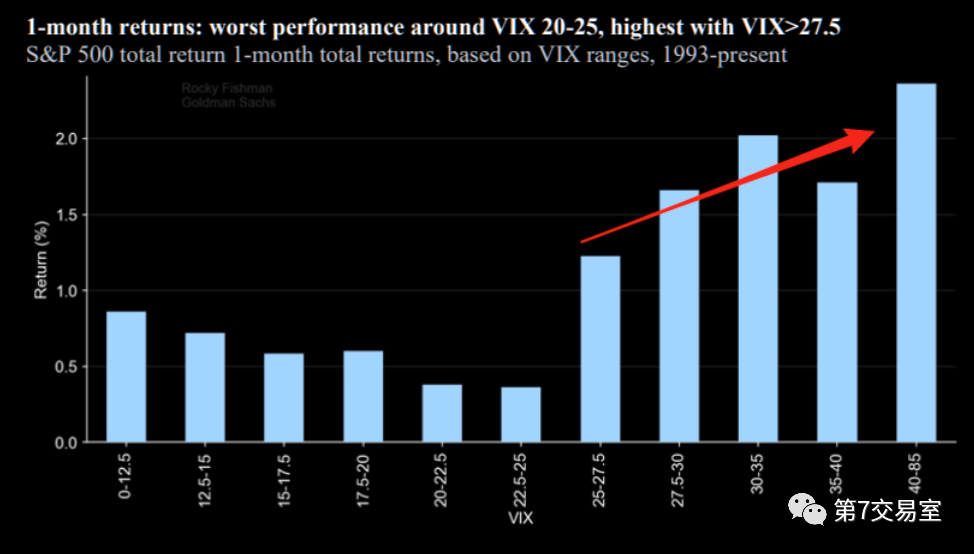
When the VIX reading is higher than 27.5, the return probability of S&P in the next month will greatly increase, indicating that when the VIX exceeds 30, the high probability is the market bottom of US stocks in the short and medium term.
Ok, through these data, we can almost see at a glance that history has told you the basic script of the future of US stocks: short-term rebound, late declining and bottoming, and in the long term, the market will reverse and break through and continue to rise in October.
Let's look forward to the performance of this US stock script, what do you think about it?
Comments