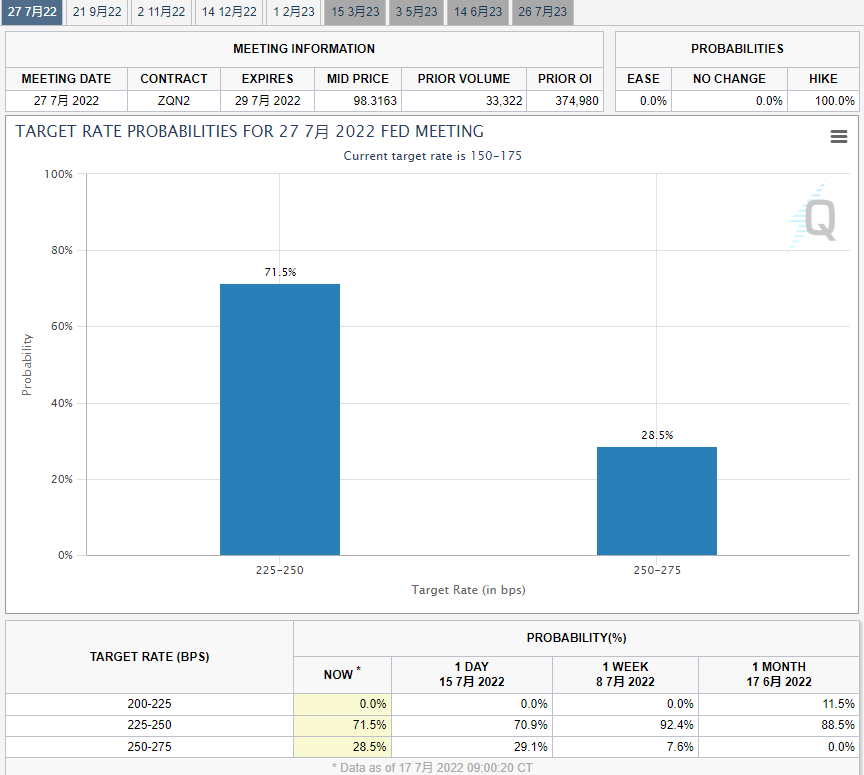
The Fed's interest rate resolution at the end of July is undoubtedly the highlight of this month.
After the CPI data hit a high level again, the market once priced in a 100 basis point interest rate hike. However, with the digestion of time, we can see that the probability of 75 basis points has returned to the dominant position at the beginning of this week. This may mean that the final situation of this resolution will change in the next nine days. The only thing to keep in mind is that the result can be basically set with a probability of more than 70%.
Inflation looks at oil price, risk assets also look at oil price
Crude oil bottomed out again last week, sticking to the 92/93 area for two consecutive weeks. Biden has specifically said after the CPI data that the fall in gasoline prices will benefit the inflation correction.
In fact, in the past six weeks, oil prices have fluctuated downward. Therefore, the data in July does have a high probability of falling from the high level.
There was a delicate relationship between oil price and inflation and stock market. On the one hand, if oil prices rise and inflation is high, the pressure on the Fed will be great, and the market will naturally not be better; On the other hand, oil prices can also represent economic prospects and risk appetite. If oil prices drop significantly, risky assets will also drop with great probability.
Based on this, we have a rough judgment. If the oil price is confirmed to break the aforementioned support position this month,it will open up a new round of falling space. This will ease the urgency of raising interest rates, thus helping risky assets to rebound and correct. But in the long run, there will be more declines after the rebound.
If the oil price holds its support and rises again, it is just another situation: risky assets continue to bottom out, but in the medium term, there is still room for deeper rebound. However, whether it is rebounding first and then falling, or falling first and then rebounding, the risk-off model will be the main trend in the long run. Assuming that oil prices and stock prices are sharply different, we should pay more attention to the risk of a big crisis.Similar to 07/08.
Silver is low or tested before gold enters the supporting area
After breaking away from the mid-term bulls of gold, the downward trend of gold price continued, and fell below the integer level of 1700 last week.
Gold and silver seem to have become the outcast of the market in recent months. No matter whether the major markets panic or repair, gold lacks the intervention of new buying, and there is no sign or news of any change.
Silver has begun to test the dual support area of 61.8% callback position + 2020 high. If this position continues to fall, there will be no reliable technical support to rely on below. which is also an open field. Compared with the effectiveness of betting breakthrough, the daily and weekly volatility indicators ATR of silver are at a relatively low level, and gold has little fluctuation.
From the trading point of view, it is possible to consider doing long volatility. If the confirmation direction is downward, it may be necessary to reevaluate the trading logic and strategic options of gold long-term.
$E-mini Nasdaq 100 - main 2209(NQmain)$ $E-mini S&P 500 - main 2209(ESmain)$ $E-mini Dow Jones - main 2209(YMmain)$ $Gold - main 2206(GCmain)$ $Light Crude Oil - main 2208(CLmain)$


Comments