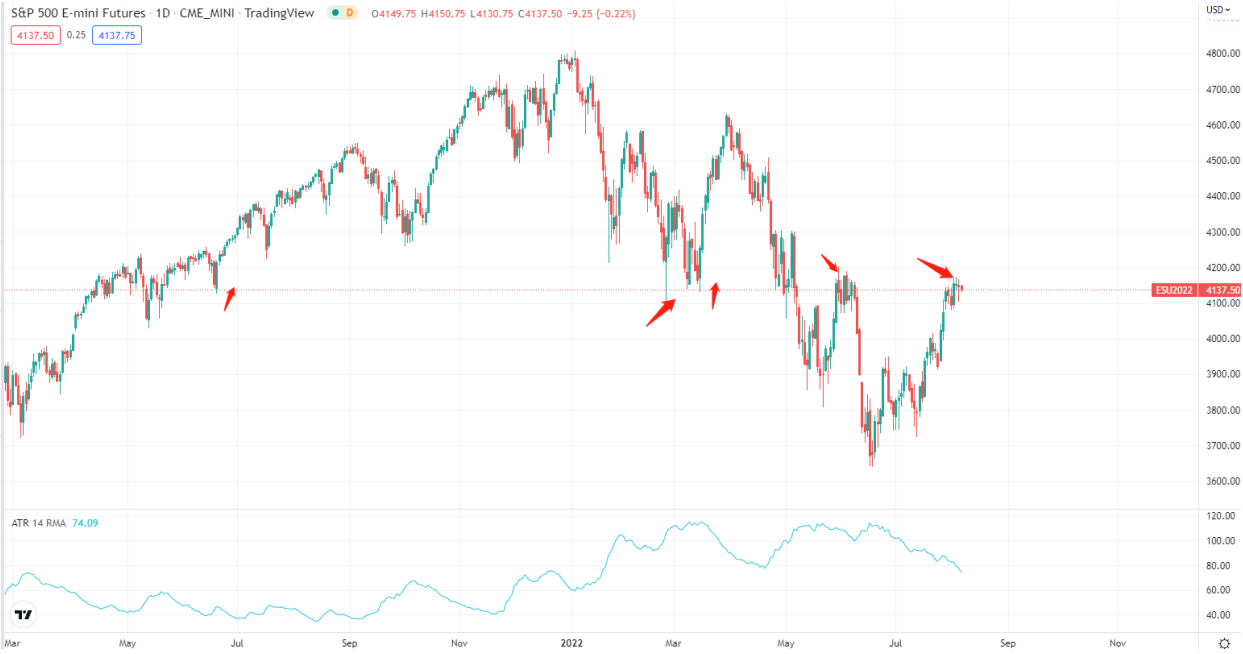
Since mid-June, the rebound of US stocks has lasted for nearly two months, and the rebound space has also reached double digits.
After the Fed's curse was temporarily lifted, the market seemed to lack the reason and logic to be bearish. However, from the price/graph point of view, the market is near a key level, and bulls may need to pay attention to the risk of short-term decline.
The rally is unlikely to stop abruptly
From the long-term performance, although the price has reached a cautious position, it is still relatively positive in structure. Whether it is the monthly chart swallowed by the positive line or the breakthrough of the positive line at the end of July, it implies that the rebound of this round is unlikely to end in this small challenge.
From the daily chart, 4170-4250 served as the fulcrum of rebound, and it was also the position of rising and falling at the end of May. The logic of supporting resistance conversion means that the long position previously will choose to leave here. If we successfully break through this area, the next strong resistance will appear at 4500/4600, where it is quite difficult to make progress.
For long traders, we can consider the hedging strategy at present, Shorting is not a suitable option at present, because there is no clear reversal signal. Before the Federal Reserve's decision in July, the low of 3900 fell below the previous level, and the overall level still belonged to the rebound rhythm.
As for the impact of the Federal Reserve, in the short term, due to the policy vacuum period, there are basically not many positive or negative impacts. Interestingly, fedwatch shows that it is more likely that the Fed will raise interest rates by 75 basis points in September, exceeding 70%. However, we expect that this data may change later. Or the decision-making in November and December is more dovish.
In addition, it is worth mentioning that during this rebound, US stocks and gold have maintained a very obvious positive correlation. With silver's correction last week, it may also be a forward-looking indicator. Gold is relatively more resilient and has not fallen below last year's low, but bulls need to prove themselves better before they can announce the return of the king. However, the negative correlation with the US dollar index is still not very optimistic.
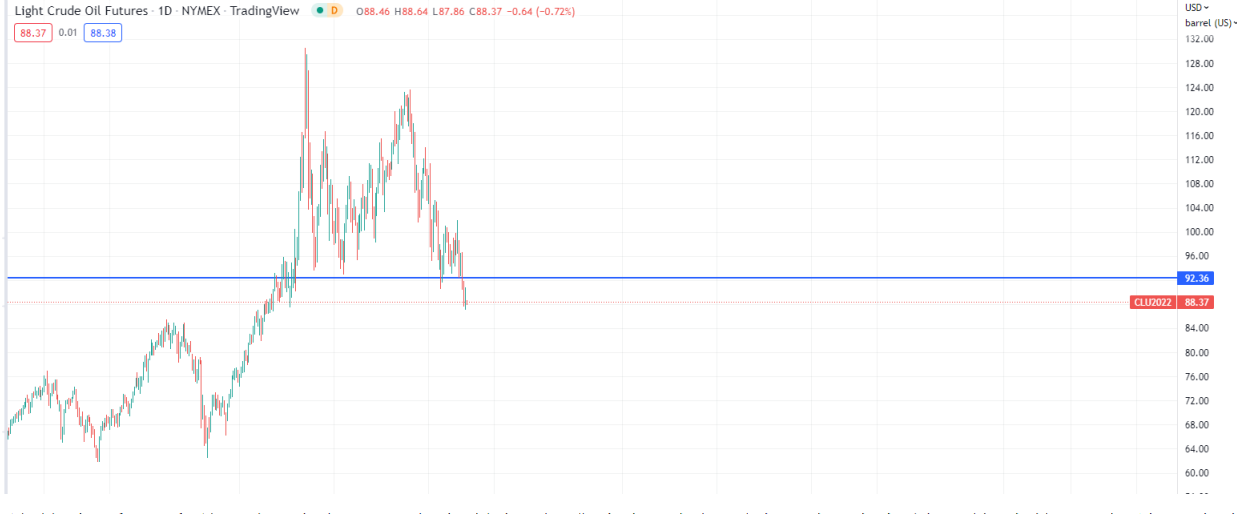
The downward break of crude oil has dragged down risky assets for a long time
In the process of slowly rising US stocks, oil prices quietly fell below the 92/93 core support area. As we said a few weeks ago, the path of falling oil prices-less urgency for the Federal Reserve to raise interest rates-and the stock market rally first is being fulfilled. However, rebounding first and then going down is also the outcome that risky assets will face in the future.
On the whole, the rebound is over half, and the opportunity in the second half will be relatively more difficult. The good news is that there is usually a lag of about a quarter between oil prices falling and risky assets suffering. There will be a buffer zone for changes in economic expectations (in other words, higher shipments), and smart investors will take advantage of this opportunity.
$E-mini Nasdaq 100 - main 2209(NQmain)$ $E-mini Dow Jones - main 2209(YMmain)$ $E-mini S&P 500 - main 2209(ESmain)$ $Gold - main 2212(GCmain)$ $Light Crude Oil - main 2208(CLmain)$


Comments