When last week's US CPI data confirmed the market's conjecture of "inflation peaking", the long sentiment was ignited overnight.
S&P immediately broke the front resistance level of 4200, and tested the 200-day moving average upward. From the short-term technical point of view, almost all the indicators we mentioned before turned over.
Among the four key indicators of S&P, except OBV, which remains low, all the other indicators give almost crazy bullish signals:
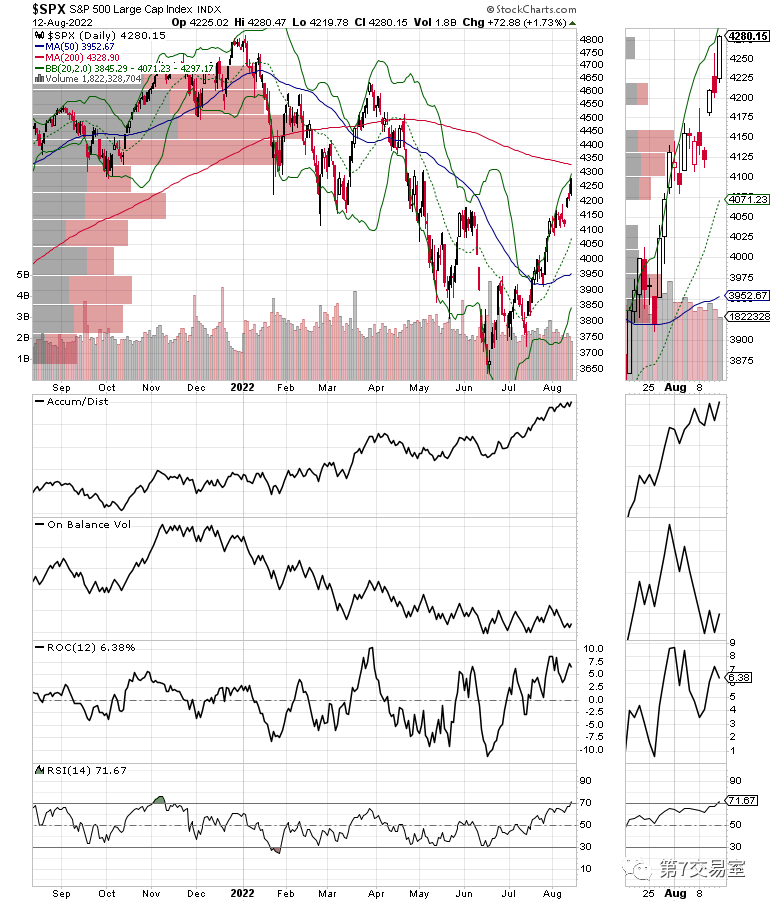
However, the proportion of constituent stocks exceeding the 200-day moving average has reached 48%, which is the same as the 200-day moving average to be tested by S&P, and has reached a short-term resistance level. There may be some small repetitions at the opening this week.
However, I have to admit that it is difficult to extinguish the long sentiment of the US stock market in a few days. When the S&P's 4-hour topping shape was broken, more space above was knocked open by bulls.
Markets no longer trust the Fed Will the correction of US stocks come again?
Last Tuesday, we gave our own judgment that it is very likely that US stocks will peak in stages, while the pattern of long-term bear market rebound remains unchanged.
Are we wrong?
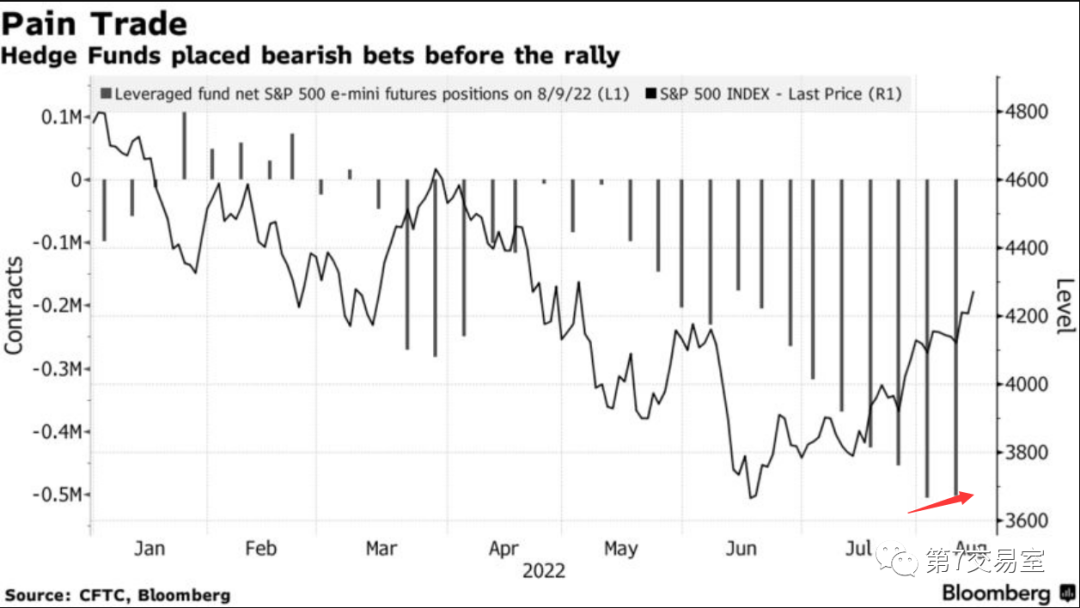
Take a look at the latest data from CFTC (Commodity Futures Trading Commission). In the past two weeks, the number of short positions in S&P 500 futures has reached the maximum since 2015, while the basket of the most shorted stocks tracked by Goldman Sachs has risen by 39% so far in June.
Short positions in leveraged funds have fallen by less than 10% amid a near-insane market rally.
There are many people who insist on being bearish. Even when we accurately predicted that US stocks bottomed out in early July, the short positions on CFTC were still increasing.
When the market lost its faith in the Fed,
the chaotic market had already started.
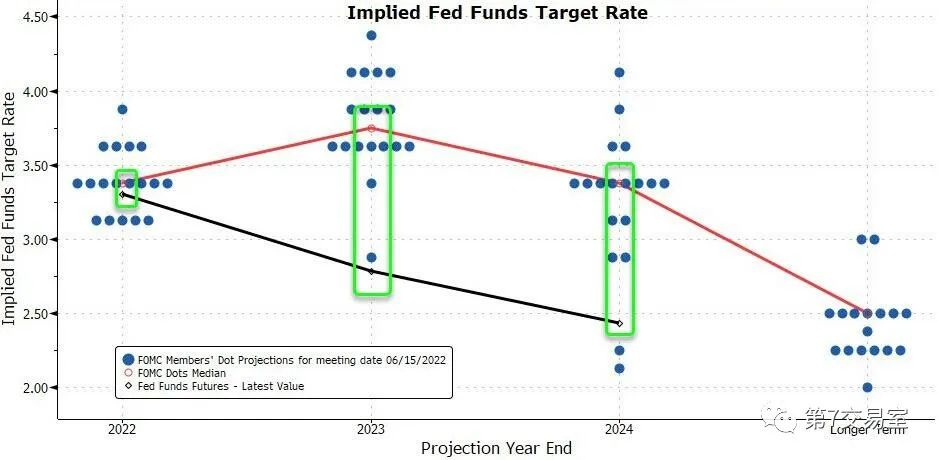
We shared a key trend chart early last week:
The comparison between the forecast of market interest rate by federal funds interest rate futures and the bitmap of the Federal Reserve shows how deviating the forecast of interest rate between the market and the Federal Reserve at present!
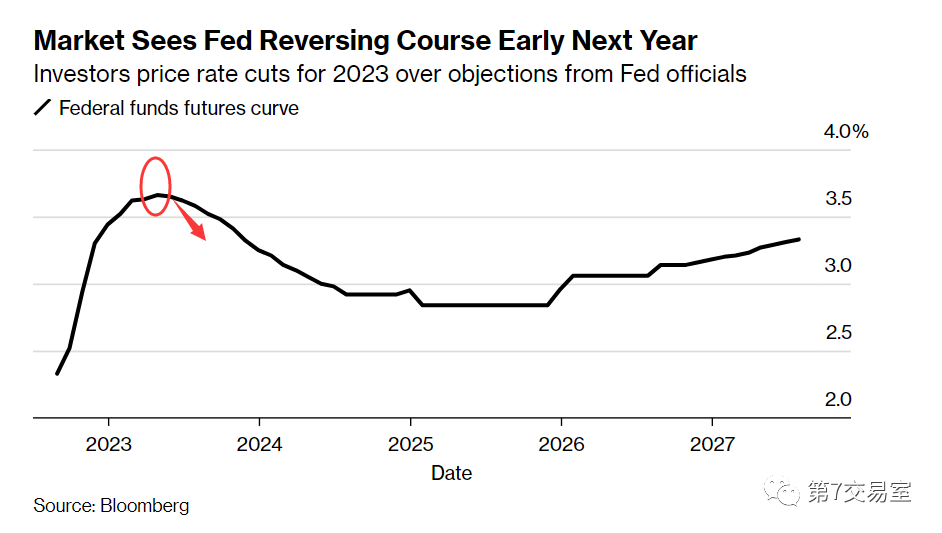
Even now, the price structure of federal interest rate futures still indicates that interest rates will peak in Q1 of 2023 and cut interest rates (black line)
Fed officials have repeatedly voiced hawkish voices and told the market through bitmap that the whole 2023 may be in the process of raising interest rates. (Red line)
But does the market believe it? The market deceived by Powell many times no longer believes that the Fed dares to withstand the pressure to raise interest rates.
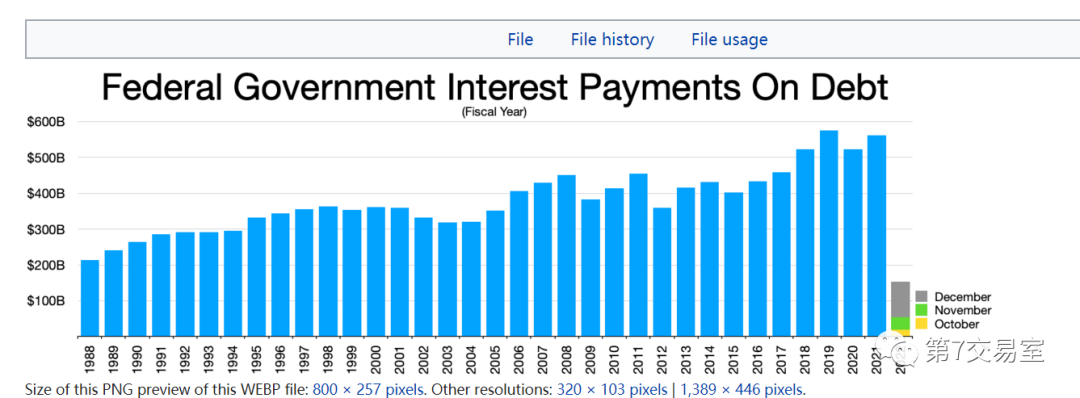
Why? It's very simple, because the interest rate is simply astronomical:
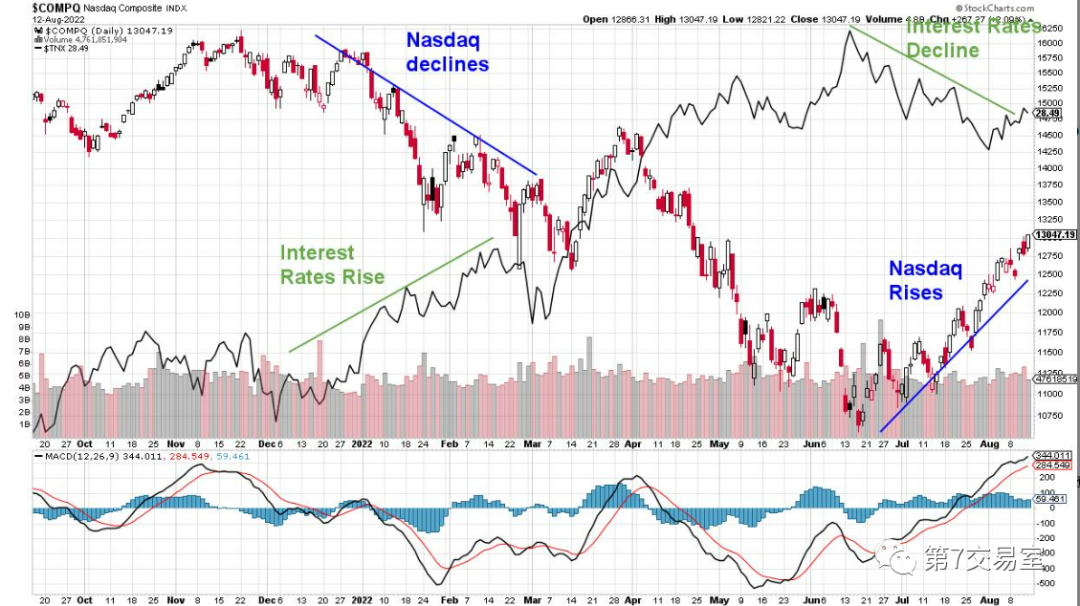
You see, the future development path of market interest rate has always been the core factor affecting the pricing of global risky assets.
Look at the trend comparison between the S&P index and the 2-year US bond yield
Is there an obvious negative correlation?
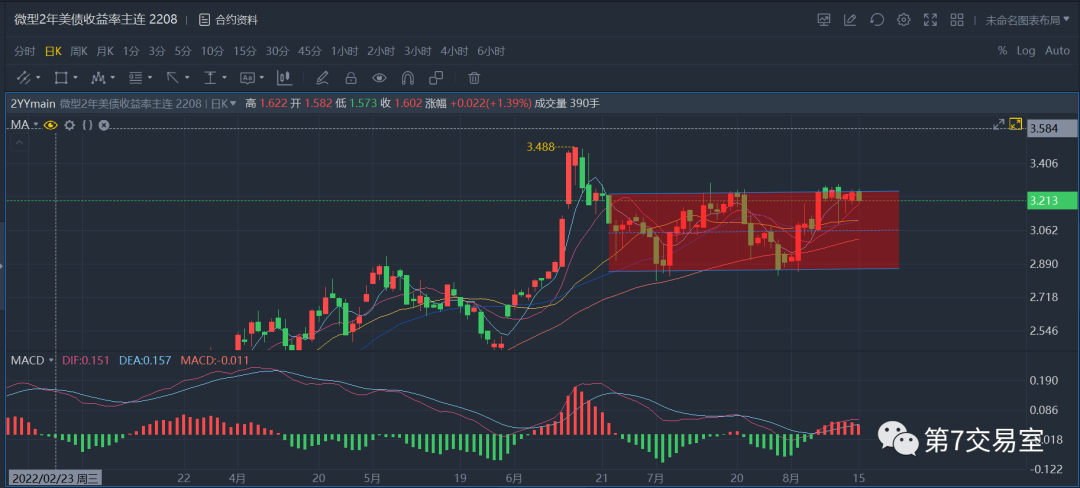
However, as I shared last week, the 2-year US bond yield futures have been hovering around 3.2 at present, and have not plummeted as predicted by the federal funds rate futures, which shows that the bond market is not as optimistic about the future interest rate as the stock market.
Once the balance between market and interest rate tilts again, the retracement of US stocks will be triggered at any time.
$E-mini Nasdaq 100 - main 2209(NQmain)$ $E-mini Dow Jones - main 2209(YMmain)$ $E-mini S&P 500 - main 2209(ESmain)$ $Gold - main 2212(GCmain)$ $Light Crude Oil - main 2208(CLmain)$
Comments
Wow