Summary
- We analyzed the company as the largest in the world with a 21% market share and determined its strong competitiveness based on 106 compiled EV data points.
- As it expands outside into China and Europe, we expect its growth to be supported by its expansion with a forecast automotive revenue growth rate of 47.6% in 2022.
- Moreover, we believe its profitability could continue rising with its focus on China and in-house production to reach a net margin of 43% by 2026.
- Despite its leading position, we believe Tesla stock is perfectly priced and already reflecting in its future growth.
Tesla Inc (NASDAQ:TSLA) is the largest EV company in the world with a unit sales market share of 21% in 2021. We analyzed the EV market and Tesla's market positioning in theEV market in terms of its market share. We also looked into its technological capabilities and compared it against competitors in aspects such as the self-driving capability to determine its competitiveness in the EV market.
Moreover, we looked into its expansion overseas in Europe and Asia and analyzed the market growth outlook in these geographic regions compared to its home market in the US. Based on its expansions, we projected its automotive production and sales growth.
Lastly, we examined Tesla's supply chain and sourcing strategy as it increasingly moves to the in-house production of components. We analyzed its margins and estimated it going forward with the impact of its overseas production and internal production.
Leader In the Fast-Growing EV Industry
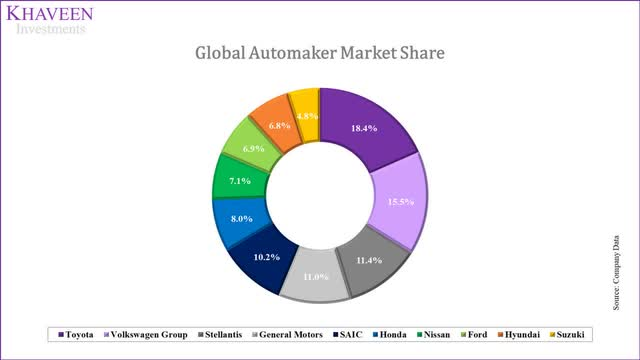
In 2021, Toyota (TM) held the title as the market leader of the automaker market with the highest share. This is followed by Volkswagen Group (OTCPK:VWAGY), Stellantis (STLA), General Motors (GM) and SAIC which made the top 5. The top 5 consisted of 2 automakers from the European and Asian geographic regions each with General Motors the only US company in the top 5. This is followed by the remaining 5 largest companies which are Honda (HMC), Nissan (OTCPK:NSANY), Ford (F), Hyundai (OTCPK:HYMTF) and Suzuki (OTCPK:SZKMF). Except for Ford (US-based), the rest of the automakers were based in Asia. Tesla did not break into the top 10 largest automakers in 2021.
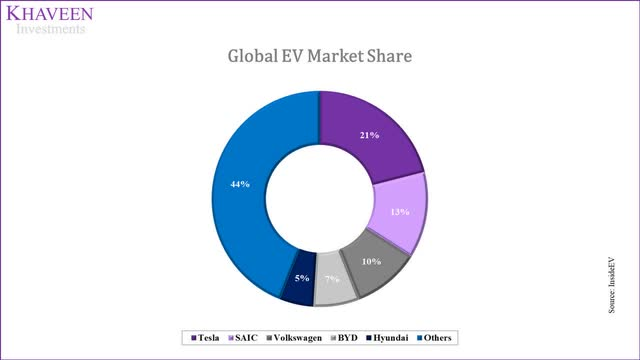
Notwithstanding, according to InsideEVs, Tesla was the market leader in the EV market with a share of 21% of EV unit sales. This is followed by SAIC and Volkswagen which are both the largest in their home markets of China and Europe, respectively, followed by BYD (OTCPK:BYDDF) and Hyundai in the top 5 EV automakers worldwide. In the US specifically, Tesla had dominated the US EV market as it retained its title as the market leader over the past 5 years. However, its market share decreased in 2021 with increasing competition from other automakers such as Chevrolet, FIAT, and Volvo (OTCPK:VOLAF), which gained market share. Globally, Tesla is the market leader in 2021 with the highest market share of unit sales.
To identify Tesla's market positioning and to compare it against competitors in the EV market, we compared it against competitors based on several factors including the number of EV model variants, range and average base price. According to data from InsideEVs, we compiled a total of 106 EV models from 18 different EV companies and calculated each of their number of EV model variants, average base prices and range. We plotted these data in the bubble chart below with the range and the number of models on both axes and the midpoints of each factor based on the median and the size of each bubble represented by their average base prices where we see the smaller the circle size, the stronger the advantage for the company.
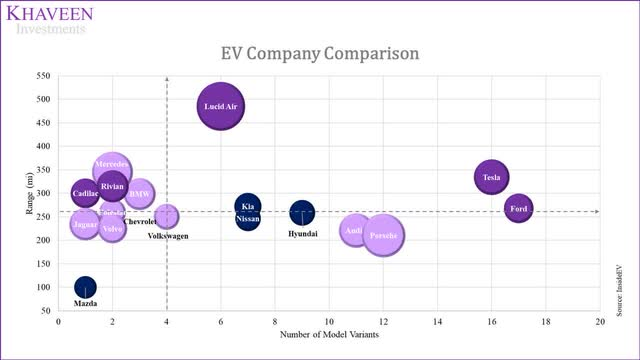
*Circle size represents average base price
Based on the chart, Tesla is placed in the top right quadrant with a higher number of EV model variants such as the Model 3, S and X, than the midpoint of 4 models. Its average range is also above the midpoint, which is around 260 miles. We believe this highlights Tesla's strengths with a wide variety and above-average range. Besides Tesla, the companies in the top right quadrant are Lucid (LCID) Air, Kia, Hyundai and Ford. Meanwhile, in the bottom right quadrant, Porsche (OTCPK:POAHY), Audi (OTCPK:AUDVF) and Nissan are placed there with a high number of models but poor range. On the left side of the chart, most companies are in the top half (5 out of 9) and represented mostly by European-based automakers (6 out of 10) including Mercedes (OTCPK:DDAIF), BMW (OTCPK:BMWYY), Polestar, Jaguar, Volvo and Volkswagen.
Moreover, in terms of pricing, the company with the highest average price in the chart is Lucid Air, which is lifted by its expensive Air DreamEditionbut with one of the highest battery capacities and range. Tesla's average price is lower than Lucid Air, Mercedes and Porsche, but has a wider variety with a higher number of EV models at 16 which is the second-highest behind Ford. On the other hand, Chevrolet and Mazda both have the lowest average price with a low average battery capacity of 65kWh and 35kWh which are the lowest and below the average of 88 kWh.
All in all, based on our chart, we believe Tesla is placed as the best in the EV market due to its high number of models, which is only behind Ford. However, Tesla edges out over Ford with a higher average range, thus we place Ford as the second best. Although Lucid Air has a better range than Tesla, we believe its high price is a disadvantage to Tesla and we ranked it as the third-best company. In contrast, we believe Mazda is placed in the worst position with a low number of models and poor range with tough competition at its price point from other competitors.
While we find that Tesla's pricing is generally higher than competitors, we also note its technological innovation. The company's EVs are equipped with its Autopilot technology to provide driverless assist capabilities using vision-based sensors. According to its annual report, it is also developing its full self-driving ('FSD') capabilities running on neural networks in its vehicles and is currently in beta testing. According to its latest earnings briefing, the company highlighted its FSD program having over 100,000 people and it expects to expand this year.
However, several of its competitors also provide similar capabilities such as adaptive cruise control and lane-centering steering including Audi, BMW, Ford, Hyundai, Mercedes, Nissan, Polestar, Porsche and Volkswagen. Besides that, Tesla also provides over-the-air updates to improve the vehicle functions of existing Tesla EVs. According to Munster, while other automakers also provide OTA updates, they are focused on infotainment features whereas Tesla extends these software updates for its EVs to improve range, power, braking, safety, and driver-assistance features.
Expansion into Europe and Other Countries
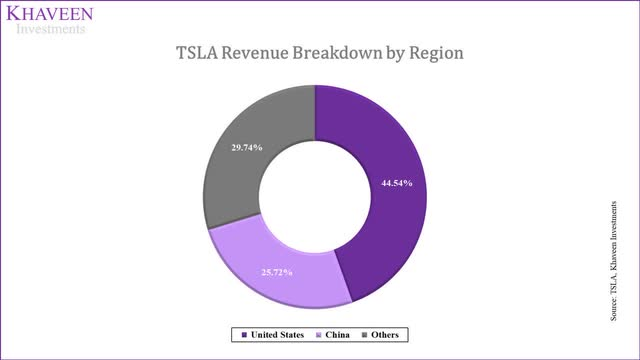
Tesla's largest geographic region based on its annual report is the US, which accounts for nearly half of its revenues, while China is its second-largest region with the remaining categorized as its Others segment. The company's geographic revenue indicates its limited presence beyond these regions as most of the company's manufacturing bases are located in the US and China as seen in the table below.
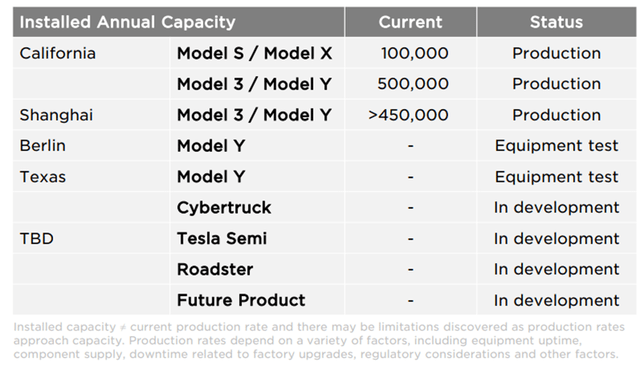
According to Tesla, the majority of its production sites are located in the US with a Gigafactory in Texas announced to be opened by April 2022 with an expected capacity of 500,000 for its Model Y. However, the company had been expanding its production facilities overseas with a Gigafactory in Germany which recentlyopenedwith a capacity of up to 500,000 vehicles. This is its second facility outside of the US besides its Gigafactory in Shanghai which opened in 2019.
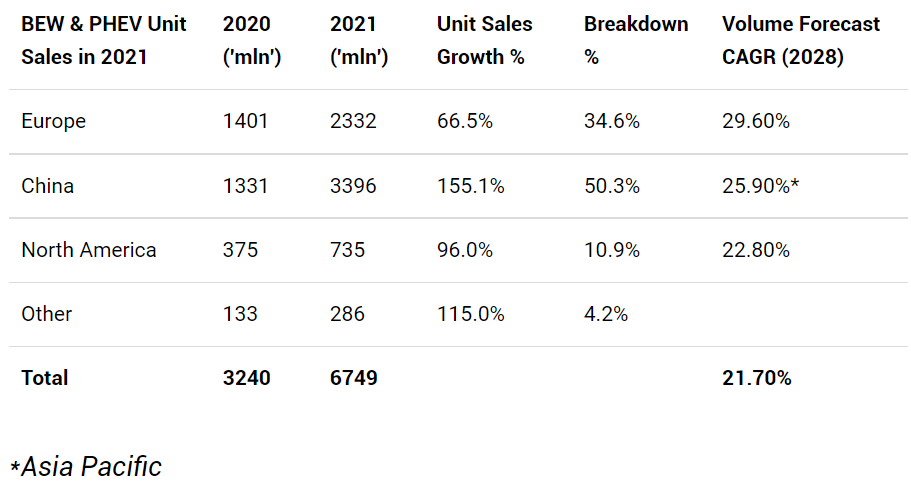
From the table, the largest geographic regions for the EV market are China and Europe which combined accounted for 85% of total global unit sales in 2021. Meanwhile, North America where Tesla is based and derives 45% of revenue only represented 11% of the total market. Furthermore, both Europe and China have higher market forecast unit volume CAGR than North America and higher than the global average.
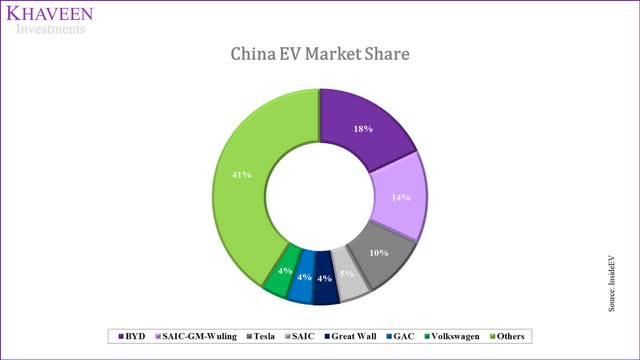
Based on InsideEVs, Tesla was the third largest EV company in China with a unit sales share of 10% in 2021 behind BYD and the SAIC-GM-Wuling joint venture which sells vehicles under the Wuling and Baojun brands. Besides Tesla and Volkswagen, the largest companies are from China which highlights their home-field advantage. For Volkswagen, its popularity is supported by consumer preference for the European automaker's vehicles and SUVs according to AutoCar. Also, it is the largest EV automaker in Europe and the second-largest automaker in the world behind Toyota.
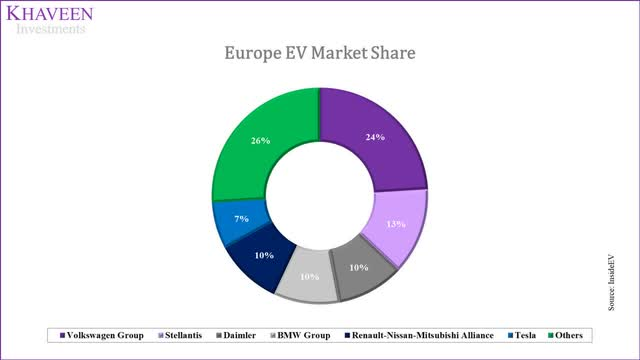
Furthermore, the largest EV companies by unit sales in Europe were Volkswagen, Stellantis, Daimler, BMW and the Renault-Nissan-Mitsubishi alliance. Tesla had a smaller share than all of these competitors. Besides the Renault alliance, all of the companies were based in Europe which we believe highlights their home-field advantage. We believe the company's expansion overseas in China and Europe could bode well for the company to increase its presence in these regions through its new manufacturing sites to cater to demand and provide tailwinds as the two largest geographic markets for EV.
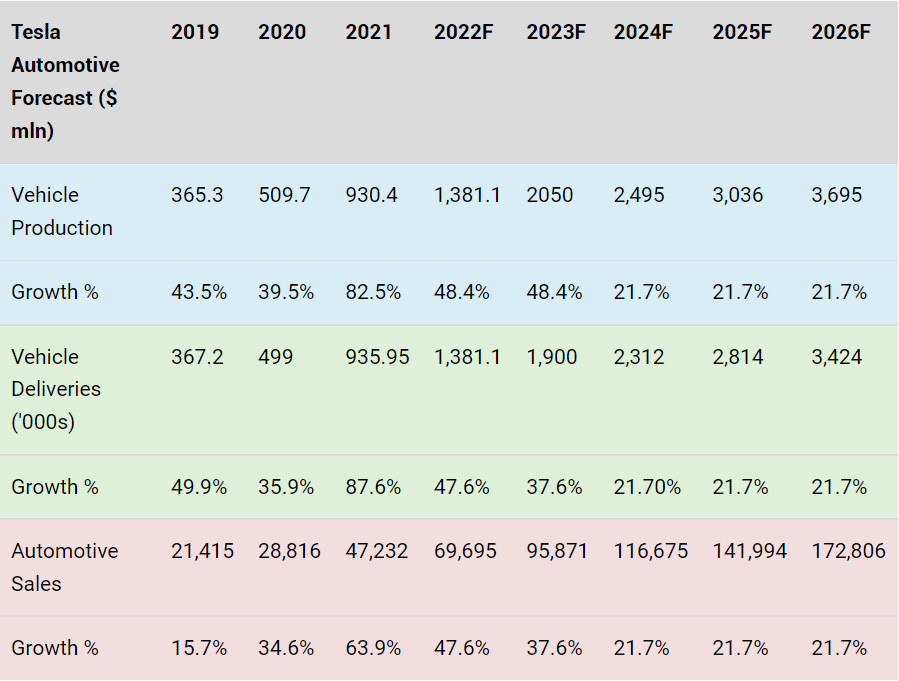
To forecast the company's automotive sales, we first forecasted its vehicle production growth based on its total capacity of 2,050 across its facilities in the US, Shanghai and Berlin. We assumed the company to reach this level by 2023 as it begins operations this year. Beyond 2023, we tapered down its growth to the market forecast volume CAGR of 21.7%. Our projections are close to management's guidance of more than 50% YoY growth for vehicle deliveries in 2022. Also, CEO Elon Musk highlighted the company's optimism about achieving this target in 2022 in its latest earnings briefing (Q1 2022).
We remain confident of a 50% growth in vehicle production in 2022 versus ‘21. - Elon Musk, CEO
Reduced Reliance on External Suppliers
According to Visual Capitalist, rechargeable Li-ion cells are the largest contributor to costs representing 77% of the total cost for the battery pack. According to Nikkei Asia, Lithium-ion batteries were estimated to account for 30% of EV costs. Back in 2019, CEO Elon Musk expected its Model 3 line's cost in China to be 50% lower than its US plants. As it expanded in the country which was ranked 5thin lowest manufacturing cost, it also expanded its local procurement such as through local battery supplier CATL (the largest EV battery maker in China with 48% share). In following its annual report, the company cited the decrease in cost per unit due to localized procurement and manufacturing in China.
The average Model 3 and Model Y costs per unit have decreased significantly due to localized procurement and manufacturing in China despite rising raw material, commodity, logistics and expedite costs - Tesla Annual Report 2021
Based on its annual report, the company depends on a select few suppliers for its lithium-ion battery cells. These include companies such as Panasonic (OTCPK:PCRFY) (14.5%market share) and Contemporary Amperex Technology (CATL) (31% global market share) which combined account for 45% of the market share. Thus, we believe this implies a risk to the company due to the high bargaining power of suppliers. Though, the company highlighted in its annual report its plan to shift to in-house production for its batteries and reduce its reliance on its suppliers. As the company increases in-house production, we believe this could reduce the risk of the company facing a margin squeeze by its battery suppliers.
In the long term, we intend to supplement cells from our suppliers with cells manufactured by us, which we believe will be more efficient, manufacturable at greater volumes and more cost-effective than currently available cells. – Tesla Annual Report 2021
According to Tesla's CEO, the company was estimated to produce 100-gigawatt hours of its 4680 battery cells in 2022 which could support 1.3 mln vehicles and aimed to halve its costs. Moreover, the company recently also announced that it will be sourcing battery components such as graphite from Mozambique, the world's second-largest graphite producer (11%share) after China (59%) through an agreement with Syrah Resources (OTCPK:SYAAF) with plans to purchase 80% of its production from 2025. According to Argus, Syrah Resources' graphite project is the world's largest integrated natural graphite mining and processing operation. Moreover, graphite price had surged by over 50% last year and Consultancy Benchmark Mineral Intelligence (BMI) expects the supply shortage for graphite to continue in 2022 with a 20,000-tonne graphite deficit. Thus, we view this move favourably for the company to secure long-term supply amid the industry shortage and potentially mitigate rising cost pressures.
Overall, we expect Tesla's shift towards in-house production to benefit the company and increase its bargaining power over suppliers. We projected its gross margins based on its COGS per vehicle as its COGS per vehicle had declined by -5.8% on a 5-year historical average and we expect the company to continue reducing its cost per vehicle as it increases its production in scale. We believe this is appropriate given the company's multiple drivers, which we highlighted were its expansion in China and in-house production of batteries. Based on its earnings briefing, management stated that their automotive gross margin has reached above 30% for the first time.


Risk: Product Reliability
The company's annual report highlighted product risks relating to its Autopilot and FSD features as well as batteries.
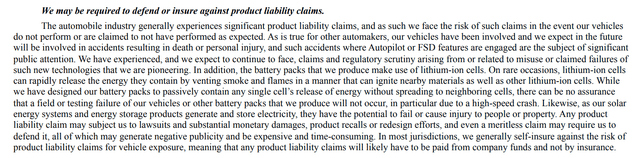
Furthermore, the company also stated that product recalls could account for significant costs for the company.
Such recalls, whether voluntary or involuntary or caused by systems or components engineered or manufactured by us or our suppliers, could result in significant expense, supply chain complications and service burdens, and may harm our brand, business, prospects, financial condition and operating results. – Tesla Annual Report 2021
The company incurs warranty expenses and provisioning. In 2021, its accrued warranty balance was $2.1 bln, which represented 3.9% of its total revenue and a decrease from 4.7% in the prior year. We believe that future product recalls could increase its expenses and affect company profitability.
Tesla had recently announced a product recall for 579,000 vehicles, which we calculated to be around 26% of total Tesla deliveries since 2016 of 2.2 mln vehicles, in the US due to a violation of federal safety standards over its Boombox sound functions. According to the National Highway Traffic Safety Administration, the company shall disable the Boombox function when the vehicle is in drive, reverse or neutral over an over-the-air software update. Thus, we believe this could arise additional expenses for the company. Based on the company's warranty expense of $0.579 mln in 2021 and its total vehicle deliveries of 2.2 mln since 2016, we estimate the average warranty expense per vehicle to be $137. Assuming this as the expense incurred with the product recall for 579,000 vehicles, we derived an estimated cost impact of $53.8 mln, which is only 0.3% of revenue.
Valuation
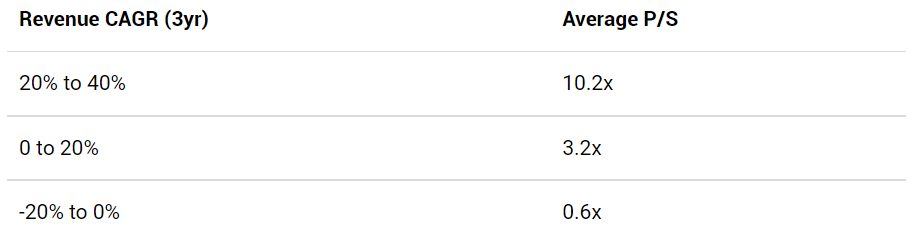
To value the company, we used a comparable valuation based on the P/S of its automotive competitors. First, we compiled our revenue projections for the company in the table below with the automotive sales forecast summarized as discussed in the previous points above. We forecasted its Services and other as well as the Energy generation and storage segment based on its 4-year historical average growth tapered down by 5% per year as a conservative estimate.

We derived our average ratios based on a tiered average with each bracket represented by their past 3-year revenue CAGR. However, a significant number of competitors had negative revenue growth.
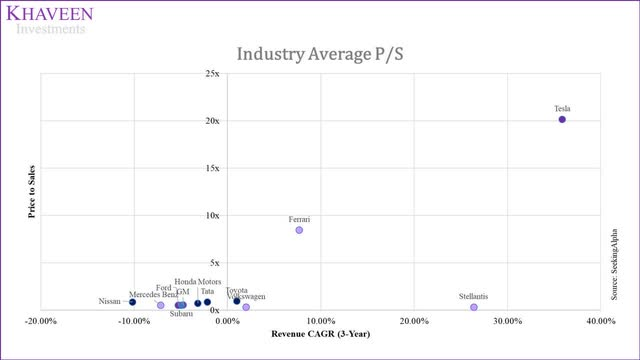
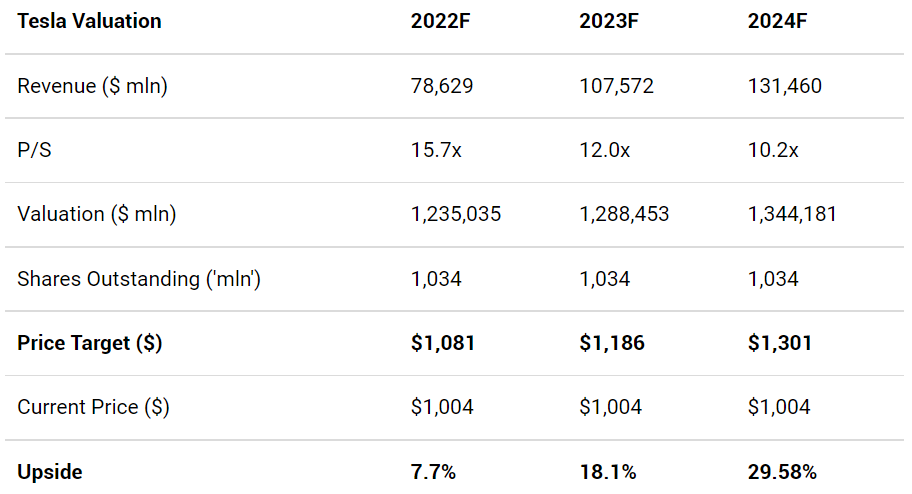
Based on our model, we obtained a 12-month price target of $1,081, which is a Hold rating for us.
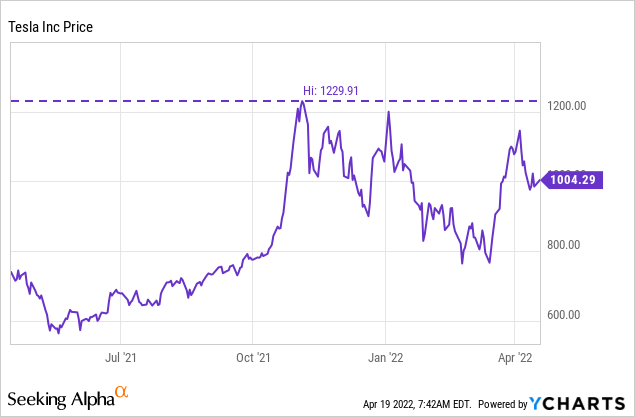
Furthermore, the price action of Tesla's stock seems to support our valuation calculation. Each time the share price reaches around 10% within our price target, the stock price consolidates.
Verdict
To conclude, as the market leader in the EV market with a 21% sales share, we analyzed its market positioning by examining 106 EV models and determined that it had relatively higher pricing in terms of average prices but also a higher number of EV model variants and better battery efficiency as measured by EV range, which places it in the top right quadrant of our EV comparison chart. Besides that, we also highlighted its advantage in terms of its software and self-driving capabilities and features which we believe could provide it with an edge over competitors. As Tesla expands overseas in Europe and China which combined account for over 85% of the EV market, we expect the company's expansion to support its growth with a projected sales growth of 47.6% in 2022. Additionally, we believe the company's expansion in China which its CEO previously stated to be 50% lower than the US and shift towards in-house could boost its margins going forward and we projected its gross and net margins to reach 43% and 23.5% respectively, assuming its COGS per vehicle continues to decrease by -5.8% through 2026. However, given the lofty stock price, we rate the company as aHoldwith a target price of$1,081.