Apple stock has dipped once again, but is it cheap at its current price? The Apple Maven uses valuation analysis to reach a conclusion.
Apple stock price continues to bounce around. As soon as the $3 trillion market cap got within reach, AAPL U-turned and dipped below $170 per share again.
Does this mean that Apple is a good stock to own on weakness? There are certainly a few different ways to approach this question. Today, I will do so from the perspective of valuations: think price-to-earnings and EV-to-EBITDA, for example.
Apple’s valuations vs. peer group
Perhaps the most commonly used valuation multiple is the price-to-earnings ratio, or P/E. It measures the price that investors pay for a stock relative to the company’s earnings per share — either historical (known as trailing P/E) or projected (forward P/E).
According to Stock Rover, Apple stock currently trades at a forward P/E of 25.6 times. This is a rich valuation multiple that sits closer to the higher end of Apple’s historical P/E range, although not at the very peak.
But should 25.6x be considered a high number in today’s market environment? Let’s compare the figure to the forward P/E of Apple’s key competitors and tech giant peers. See chart below.
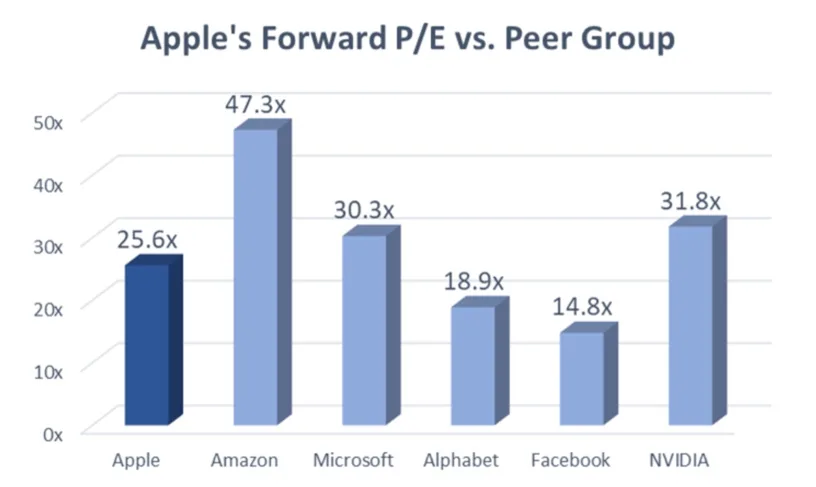
Notice that, compared to the likes of Amazon, Microsoft and Nvidia, Apple stock looks cheap. But compared to the internet giants Alphabet and Meta Platforms, Apple is richly valued. The average P/E for the group ex-Apple is 28.6x.
Of course, merely looking at P/E does not paint a full picture. For example, why might the earnings ratio be inflated or discounted?
One of the reasons could be growth expectations. The more robust a company’s long-term earnings growth potential is, the richer its P/E tends or deserves to be.
So, in order to do a better “apples-to-apples” comparison (pun definitely intended) between the Cupertino company and its peer, I suggest the following approach to normalize for growth expectations: divide each stock’s P/E by the estimate for five-year earnings increase.
The resulting metric is what we call the PEG ratio, which stands for P/E-to-growth. Below is a chart that shows PEG for each mega cap tech stock.
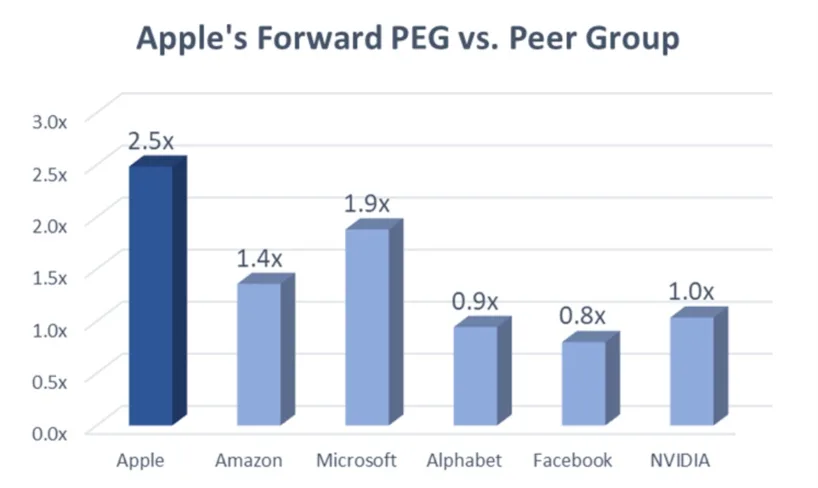
Here is the bad news for those who have just bought Apple stock: on a PEG basis, AAPL shares are the most expensive of the bunch. The 2.5x ratio is quite a bit above MSFT’s 1.9x, the second richest; and three times higher than FB’s 0.8x.
Clearly, Apple stock is expensive relative to its earnings and growth potential. But there are other reasons why a stock may be richly valued. Think of balance sheet solidity, for example, which is not reflected in earnings or earnings growth.
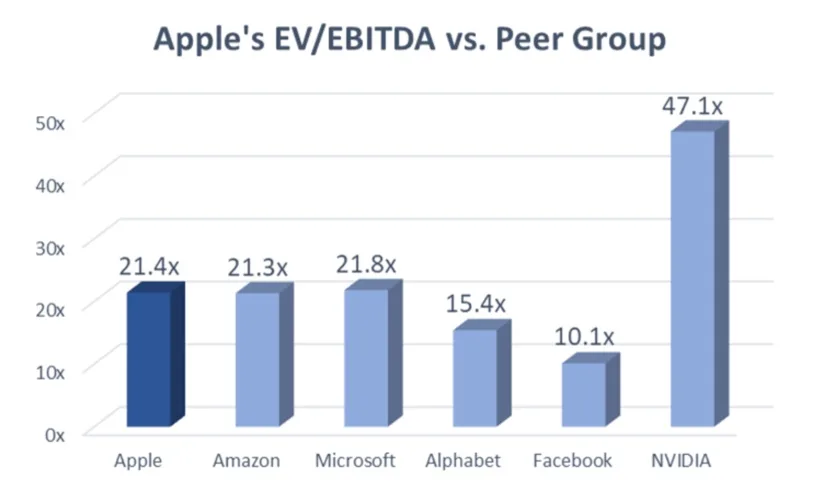
A good metric to use here is enterprise value-to-earnings before interest, taxes and depreciation — or EV/EBITDA. The numerator in this equation adjusts for net cash on hand, and rewards companies that have better liquidity.
Using this valuation metric (see chart below), notice how NVIDIA sticks out as an absurdly pricey stock. Apple is on par with Amazon and Microsoft, and more expensive (once again) then Alphabet and Meta.
The verdict: is AAPL cheap?
Based on the traditional valuation metrics discussed above, it is hard to argue that AAPL is a cheap stock. At most, one could say that shares are worth their price, but they are probably not quite a bargain — even after the most recent stock price pullback.
But one must consider that calculating a stock’s worth through quantitative methods alone is not always easy. For example, investors may perceive Apple to be a safer stock to own — maybe due to the brand appeal, maybe because it could be a good inflation play.
After taking the more qualitative factors into account, an investor might feel quite comfortable owning Apple stock at its current share price of nearly $170.