If the U.S. midterm election cycle this year is like past ones, the stock market will carve out an important low right around Election Day in November.
That should give some hope to beleaguered investors whose stock holdings have suffered double-digit losses so far this year. A meaningful rally could be just a few weeks away.
I'm referring to the historical pattern in the stock market of pre-midterm weakness and post-midterm strength. This pattern is plotted in the chart below, which is based on the average July-December performance of the Dow Jones Industrial Average in the last 17 midterm election years (since 1954).
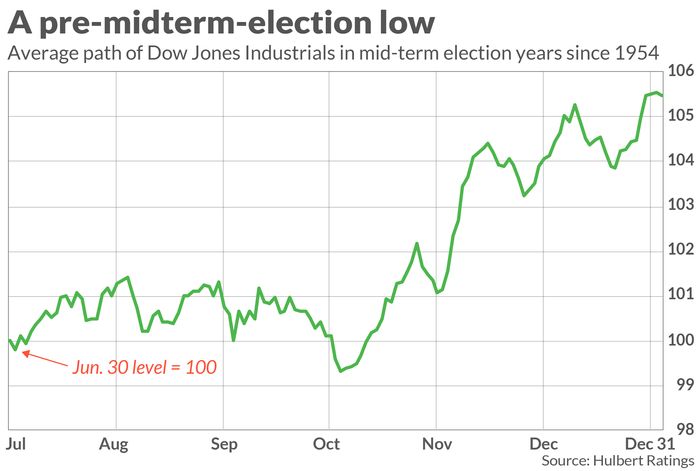
Though the date of the average in this chart is in October, the actual lows in the historical record can come earlier or later. Much depends on when the stock market begins to anticipate the outcome of the midterms and therefore discounts it. A good guess is that the low this year will be later, given the uncertainty about the election outcome -- especially in the U.S. Senate.
It's always possible that the pre-midterm low will occur in advance of Election Day. It wouldn't be inconsistent with the historical record for this year's low to have occurred the day after Labor Day, in fact. As of Sept. 9, the S&P 500 was more than 4% higher than that low.
It's worth noting how remarkable it is for any pattern to emerge when averaging together many years worth of stock market gyrations. Though each year carves out a unique path, the highs and lows usually cancel each other out, leaving the average to be a gradual upward-sloping line. A pattern has to be quite pronounced in the historical data for a deviation to appear that is as stark as the one in the accompanying chart.
This pre- and post-midterm pattern is so pronounced that it is the source of the famous seasonal pattern known as the "Halloween Indicator," according to which the stock market is strongest between Oct. 31 and May 1 and weakest the other six months of the year. Yet take away the six months before- and after mid-term elections and the Halloween Indicator disappears.
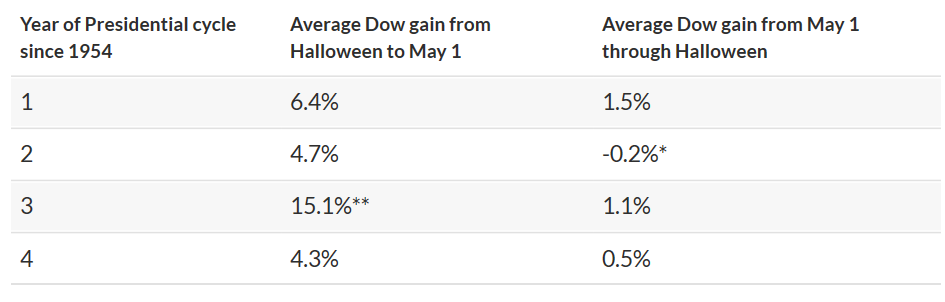
The underlying data appear in the table below. The cell marked with a single asterisk (*) refers to the current six-month period, while the cell marked with a double asterisk (**) corresponds to the six-month period that begins at the end of October 2022.
So if you are tempted to bet on the Halloween Indicator, your time is fast approaching. If you miss it, you won't have another chance until the 2026 midterms.
Credit for discovering that the Halloween Indicator traces to the months prior to and subsequent to the midterms goes to Terry Marsh, an emeritus finance professor at the University of California, Berkeley, and CEO of Quantal International, and Kam Fong Chan, a senior lecturer in finance at the University of Queensland in Australia. Their research into this pattern appeared in July 2021 in the Journal of Financial Economics.
The likely source of the pattern, according to the researchers, is the uncertainty that exists prior to the midterms and the resolution of that uncertainty after the election. They note that it appears not to matter which party dominates Congress prior to the midterms and which becomes the majority party afterwards. The pattern exists, they believe, because the stock market craves certainty, even when the source of that certainty may not be in accord with every investor's political preferences.