Chart watchers question indicator's reliability
A technical signal that has portended previous turning points for the U.S. stock market arrived for the first time in nearly three years, according to data supplied by its creator.
But some on Wall Street suspect it may no longer be as reliable as it once was.
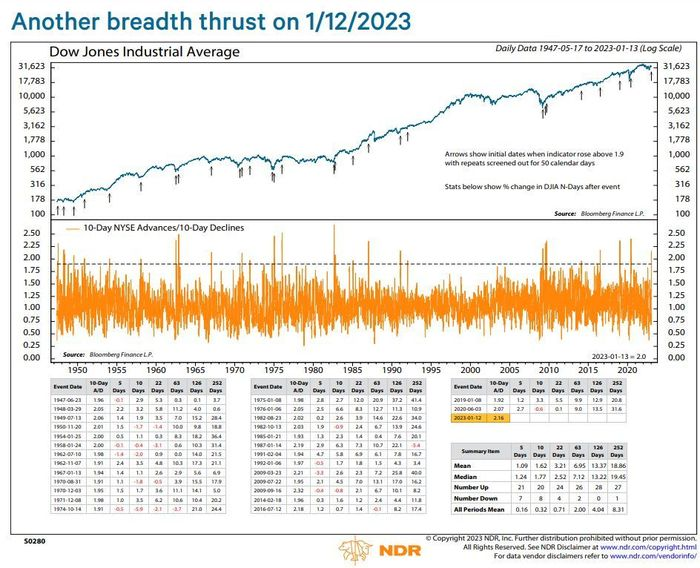
The technical indicator, which is known simply as the breadth-thrust indicator, was triggered on Jan. 12 for the first time since June 3, 2020. The indicator was created by retired analyst Walter Deemer in 1973 while he was working at Putnam Investments. A representative for the company confirmed that Deemer worked there between 1970 and 1980.
Its arrival has caused quite a stir among technical analysts, according to MarketWatch interviews with several strategists.
The breadth-thrust indicator
The breadth-thrust indicator is based on a relatively simple formula: the main input is the ratio of New York Stock Exchange stocks and other securities that advanced over the course of 10 trading sessions compared with those that declined.
When said ratio climbs above 1.97, the indicator is triggered, Deemer said. This has happened only infrequently in the years since its creation, and often it has arrived just as a new bull market was beginning.
As the breadth-thrust indicator has grown in popularity, others have created their own modified versions of it, which, like the original, purport to offer investors a more detailed view into how individual stocks are influencing the broader market's performance.
Some variations focus solely on the advance-decline ratio of common stocks traded on the NYSE, while the original uses a broad measure that includes not just common stocks but preferred shares, exchange-traded funds and other products trading on the exchange, Deemer said.
'Trust the thrust'?
Some equity analysts believe the breadth-thrust indicator and other early-stage indicators of improving market breadth have become less helpful in recent years, partly because many of them have been triggered more frequently.
Ed Clissold, chief U.S. strategist at Ned Davis Research, said that several similar indicators maintained by his firm were triggered during last year's market tumult, raising questions about their continued utility.
"The Wall Street cliché used to be 'trust the thrust' because they would be among the first indicators to signal a new bull market is under way," Clissold said in a phone interview.
"But because these thrust indicators are becoming more frequent, we now say 'trust but verify.' And the verification comes from intermediate-term breadth indicators."
In particular, Clissold said he would like to see a larger share of stocks trading above their 50- and 200-day moving averages before accepting that an enduring shift in the market's mood has likely arrived.
Mixed signals
Other popular indicators based on the NYSE advance-decline data appear to suggest that stocks may be a bit richly valued, according to Katie Stockton, technical analyst at Fairlead Strategies.
For example, the McClellan Oscillator, another popular tool for technical analysis that's also based on the NYSE advance-decline data, has reached levels consistent with last year's near-term stock-market peaks, Stockton said in a note to clients on Wednesday. This suggests that the S&P 500 has become "overbought."
U.S. stocks fell for the second day in a row on Wednesday while logging their worst daily pullback of the year so far. The S&P 500 declined by 1.6% to finish the session at 3,928.86, according to FactSet data.
The Nasdaq Composite fell by 1.2% to roughly 10,957.01, while the Dow Jones Industrial Average declined by 1.8% to 33,296.96.