Stocks are setting repeated highs, reigniting a perennial debate among investors about whether they are too expensive.
The S&P 500 has climbed 5.4% to start 2024 and closed above 5000 for the first time Friday, its 10th record of the year. The Dow Jones Industrial Average has risen 2.6%, setting 11 records along the way.
When trying to gauge whether a stock or index appears cheap or pricey, strategists recommend that investors use a combination of metrics, along with weighing the economic conditions, the overall financial health of a company and the industry's record. Investors are typically willing to pay more for companies they anticipate will expand rapidly than those whose growth prospects are more limited.
Here's what some of the popular valuation models tell us about the state of the market:
Price/earnings ratio
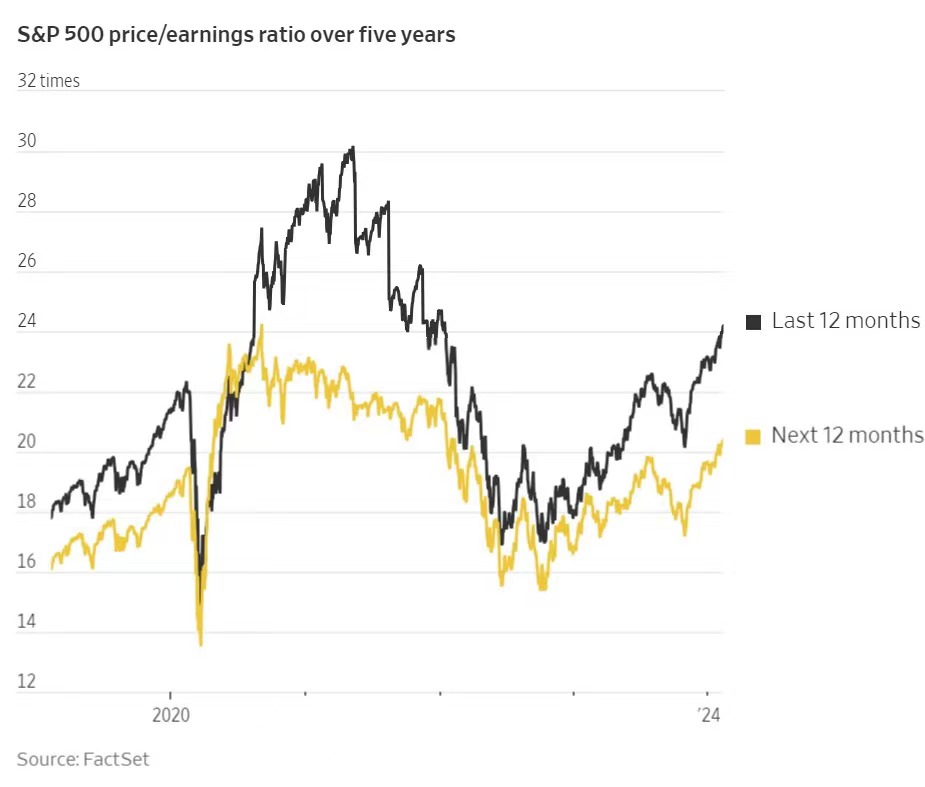
Prices are just one component of stock valuations. The other is corporate earnings. The price/earnings ratio -- calculated by dividing a company's stock price by its reported or projected per-share earnings -- is one of Wall Street's most popular tools for valuing stocks and indicates what an investor is paying for each dollar of a company's earnings.
When earnings rise and prices remain steady, valuations contract. If earnings decline, that makes stocks look even more expensive at the same price levels.
There are two different ways to calculate the ratio. Investors who prefer to look at actual results use a company's trailing earnings over the previous 12 months. Others argue that projected earnings for the coming year are more relevant, particularly for fast-growing companies in the tech sector.
Based on trailing earnings, the S&P 500's multiple is 24.18, above its 10-year average of 20.36. The index's forward multiple, at 20.38, recently rose above 20 for the first time in two years. Its longer-term average is 17.96.
"The market is fearless at this point," said Matt Smith, investment director at Ruffer, a London-based investment management services firm. "From a risk-reward perspective, U.S. equities in particular are pretty unattractive. They have a lot of momentum, but they are expensive."
Rising earnings are typically the most dependable fuel for sustained stock-price gains. During periods when stocks climb at a significantly faster rate than corporate earnings, concerns about a bubble often mount. Last year, for example, the S&P 500 rose 24%, yet profits were relatively flat.
Much of the market's gains were instead propelled by bets that the Federal Reserve would pull off a soft landing by staving off a recession and soon pivot to cutting interest rates. Equity multiples typically decline in a recession, while higher rates reduce the worth of companies' future cash flows in commonly used pricing models.
Analysts are more optimistic about the profit picture for this year and project that earnings among the companies in the S&P 500 will rise roughly 11%. That could offer stocks more room to run.
Tech stocks often command rich valuations because they are expected to generate windfall profits in the future. A mania over generative artificial intelligence spurred big bets on stocks such as Nvidia, leading to its lofty valuation. The chip maker is trading at 33.48 times its projected earnings over the next 12 months.
"They look at a Nvidia and go, 'It's trading at a huge multiple.' It is on today's numbers," said Michael Landsberg, financial adviser at Landsberg Bennett Private Wealth Management. "But if you think they're gonna grow this quickly in the next couple of years, the reality is that it's probably cheap based on some metrics that are out there."
Nvidia shares more than tripled last year to lead the S&P 500 and are the top performer in the index again in 2024, up 46%. The stock's valuation soared to more than 60 times forward earnings last year, but the multiple declined as the company reported huge profits.
Price-to-book ratio
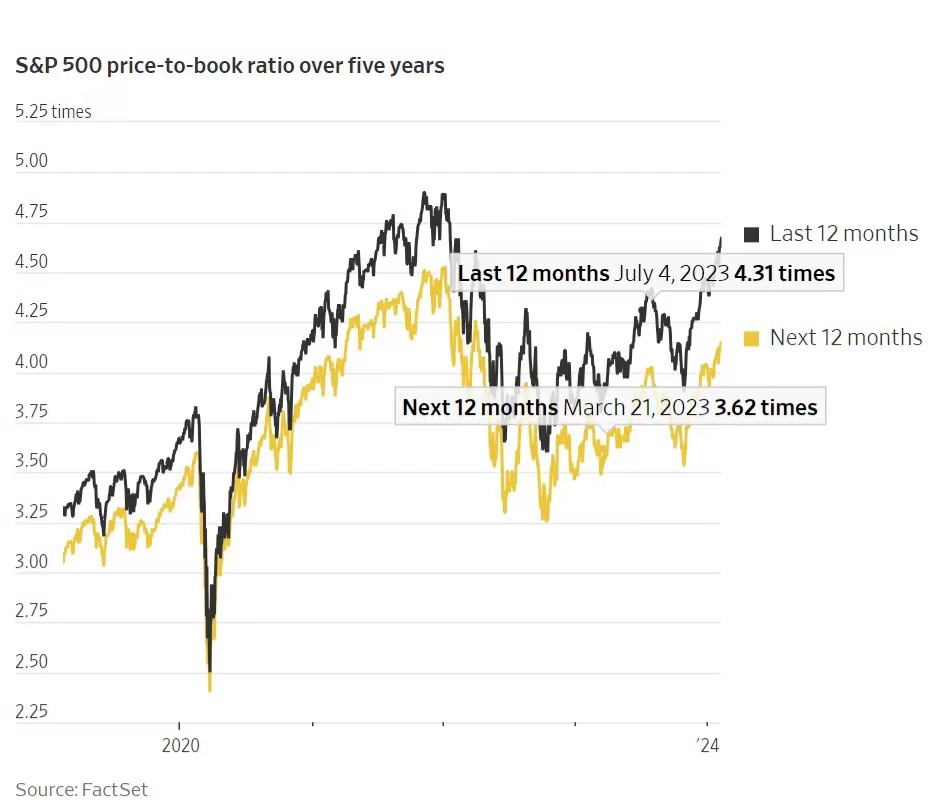
Akin to the price/earnings ratio, the price-to-book ratio divides a company's stock price by its book value, a measure of total assets minus liabilities.
The ratio is often used by investors on the hunt for undervalued stocks at reasonable prices. It is typically used to evaluate financial stocks, particularly banks, and shares of companies with tangible assets. It is less useful for tech companies because their growth prospects often aren't captured on company balance sheets, said Meghan Shue, head of investment strategy at Wilmington Trust.
The S&P 500 is trading at a forward price-to-book ratio of 4.15, above its 10-year average of 3.26 and its 20-year average of 2.76. In comparison, Nvidia's price-to-book ratio is 22.48.
Using this model, Home Depot and building-products company Masco are among the priciest stocks in the index, while Paramount Global and Invesco appear to be among the cheapest.
Equity risk premium
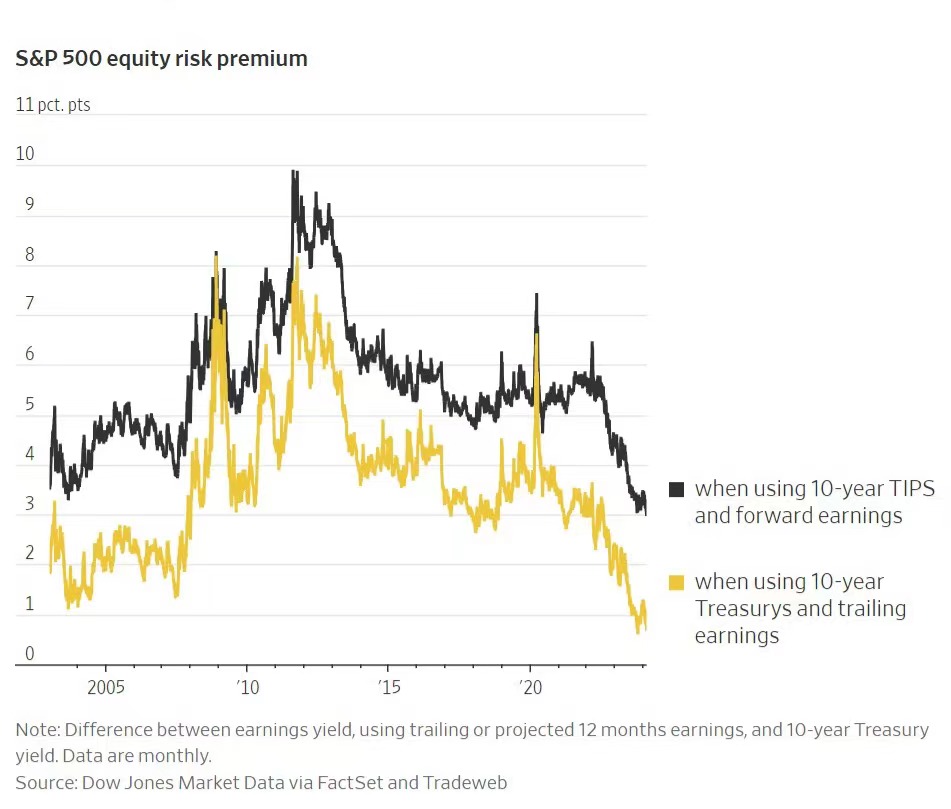
This method measures the reward for owning stocks over government bonds, calculated by taking the gap between a company's earnings yield and that of a Treasury. Equities are considered to be riskier than ultrasafe government bonds, so investors expect the former to earn a higher return over the long term.
Earnings yield is computed by dividing a company's reported or projected earnings over the next year by its stock price. Comparing the trailing earnings yield with the 10-year Treasury yield shows that the S&P 500's equity risk premium is at 0.7 percentage point, near the lowest level in about two decades. (The lower the ratio is, the more expensive stocks are.)
Smith at Ruffer recommends calculating the spread to the yield on the 10-year Treasury inflation-protected security, because corporate earnings tend to adjust with inflation. By that measure, too, the risk reward for owning stocks over bonds is at the lowest level on record, based on Dow Jones Market data going back to 2003.
Price/earnings growth ratio
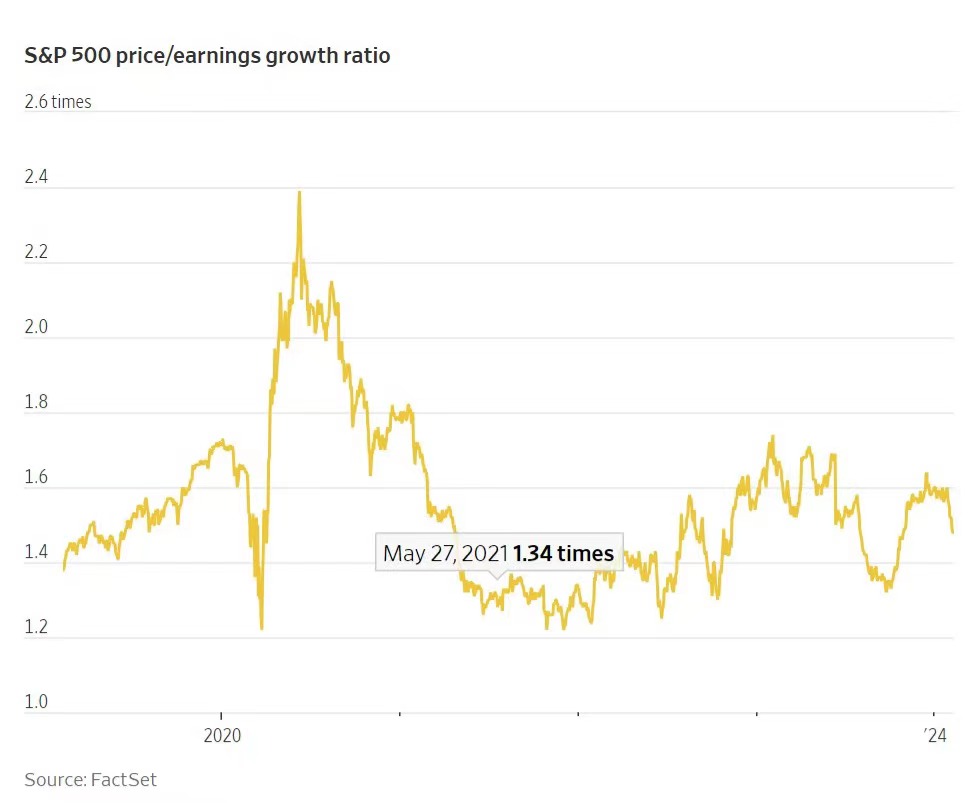
The PEG ratio is the market's valuation of a company relative to its earnings prospects. To calculate it, divide a company's price/earnings ratio over the past 12 months by its projected annual future earnings growth. A PEG of 1 indicates the stock's price is in line with its growth expectations.
The S&P 500's current PEG ratio is 1.48, below its 10-year average of 1.49 and above its 20-year average of 1.35. Nvidia's ratio of 0.78 makes it look cheap in comparison.
CAPE ratio
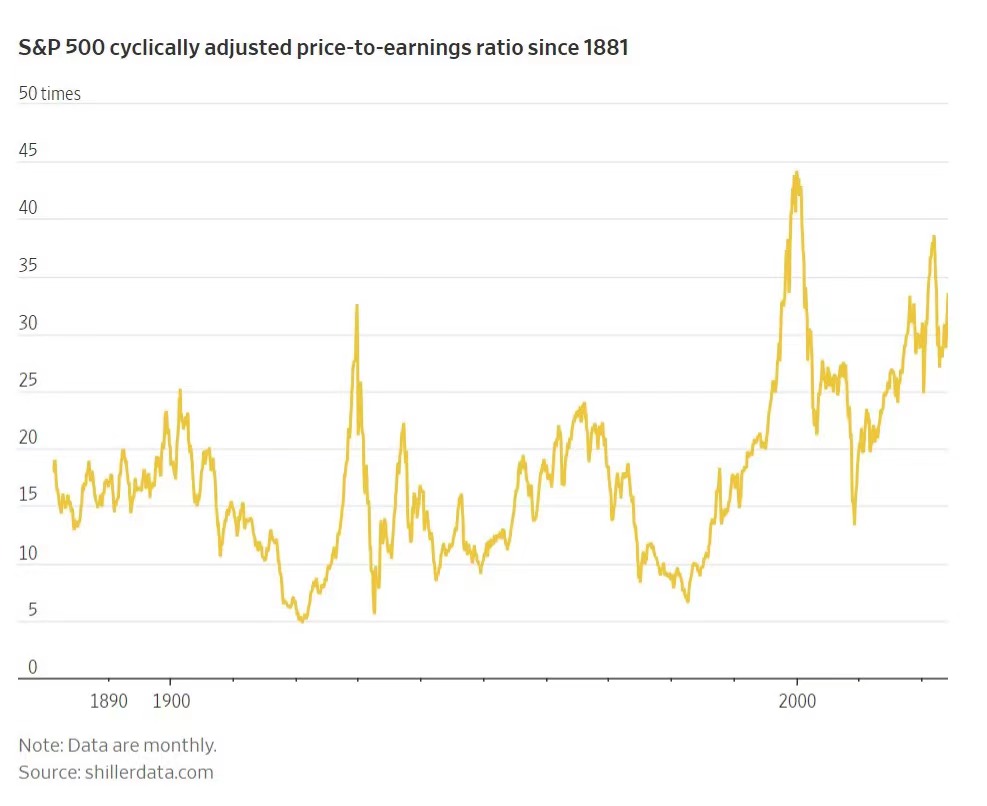
The cyclically adjusted price-to-earnings ratio was derived by Robert Shiller, a Nobel Prize-winning economist. It is calculated by dividing a stock's current price with its average inflation-adjusted earnings from the previous 10 years.
Its advantage is that it corrects for extreme good times and bad times. That smooths out periods such as just before the housing bust, when unusually strong earnings made stocks look reasonably priced, and postrecession recoveries, when weak earnings make stocks look expensive.
At 33.4, the S&P 500's CAPE ratio is higher than it has been more than 96% of the time since 1881, but it is still well below the prior peaks seen in the late 1990s and 2021.
Typically, this model is used to value cyclically sensitive companies such as banks and those in the mining and the oil and gas industries because their outlooks are influenced by consumer supply and demand and economic growth.