How have Hospitality REITs in Singapore been faring during COVID-19?
In Singapore, since the start of the COVID-19 pandemic, the Government has been using hotels and residences as quarantine and isolation facilities. This is to cushion the impact that COVID-19 has on the hospitality industry (which include Hospitality REITs). The small size of Singapore means that domestic tourism is almost non-existent. Occupancy rates have almost returned to pre COVID-19 levels since the end of Singapore’s partial lockdown back in Q2 2020 (also known as circuit breaker). This begs the question:
Will Hospitality REITs post an uptick in distributions in Q2 2021, since occupancy has almost returned to pre-COVID levels due to increased Stay-Home Notices (SHNs), Quarantine Orders and staycations?
No. This is due to RevPAR and Average Room Rate (ARR) decreasing significantly.

Even though hospitality REITs’ occupancy has increased Year-on-Year (YoY) for Q1 due to government business (e.g. SHN at dedicated facilities) and domestic staycations, Hospitality REIT results in Q2 2021 are unlikely to return to pre-COVID levels.
Below are 2 Singapore REITs reporting lower RevPAR values, despite occupancy rates rising. Both have predominantly Singapore-based portfolios. The 2 REITs are:
- CDL Hospitality Trusts (CDLHT). 66% of its portfolio value is in Singapore assets, consisting of 6 Hotels in Singapore. Its total portfolio valuation is S$2.597 billion.
- Far East Hospitality Trust (FEHT). All of its 13 properties (9 Hotels and 4 Serviced Residences) are based in Singapore. Its total portfolio valuation is S$2.53 billion.
Q1 2021 vs Q1 2020 Year-on-Year Results Comparison
Below are slides taken from each REIT’s Q1 2021 results release, showing Occupancy, Average Room Rate (ARR or ADR) and RevPAR changes.
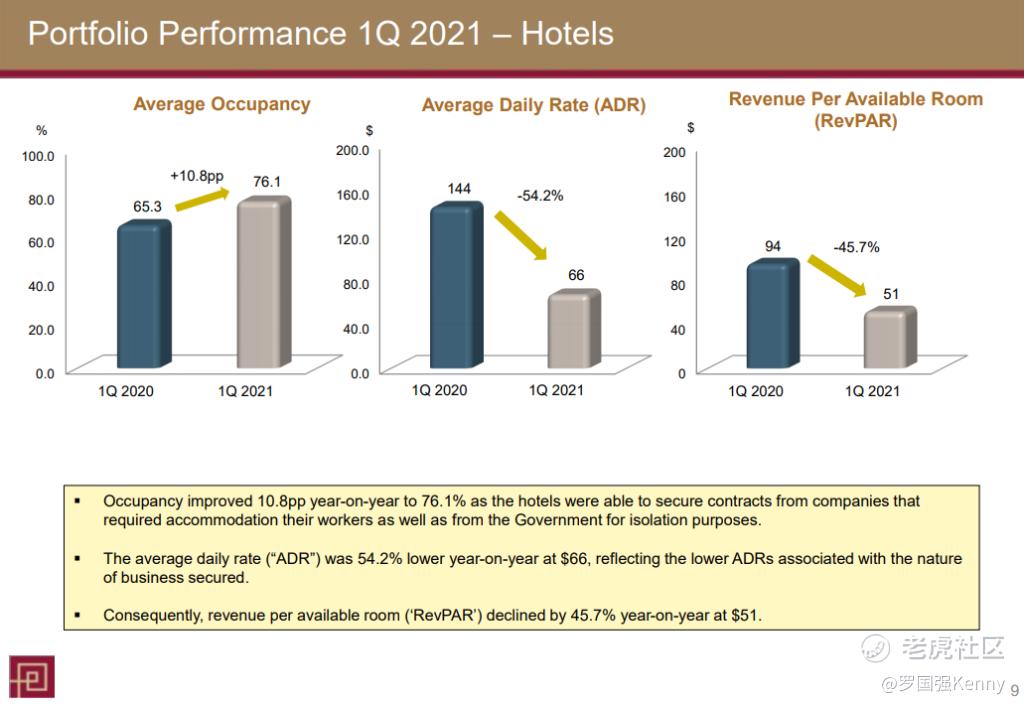
Comparing Q1 year-on-year results, despite a +10.8pp occupancy increase, Average Room Rate and RevPAR has decreased significantly (-54.2% and -45.7% respectively).
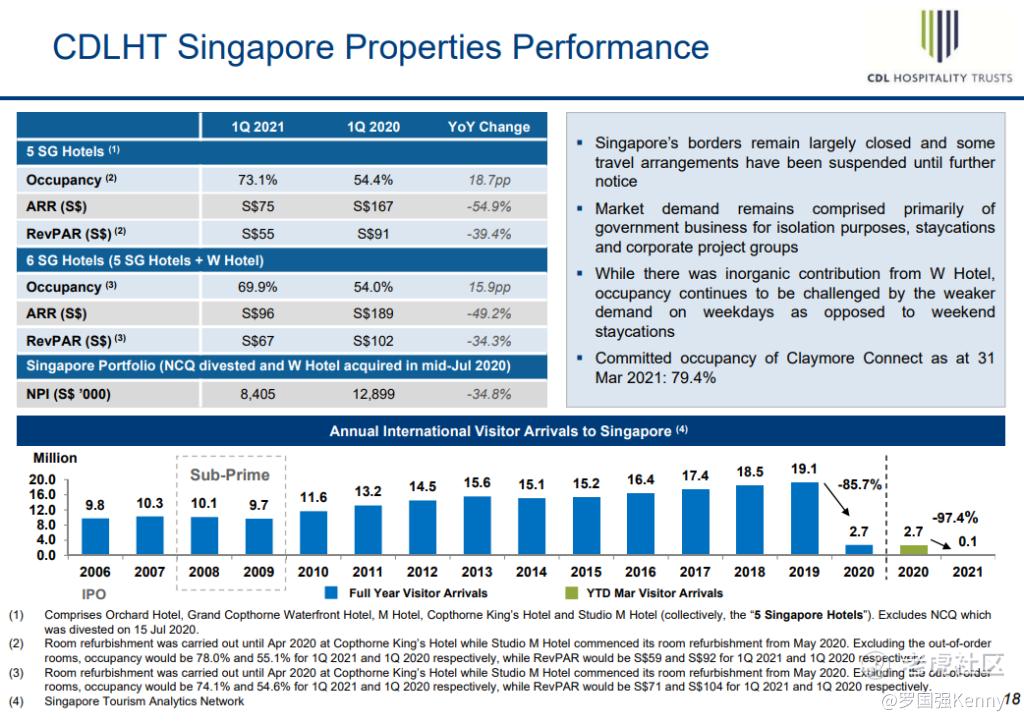
.
Comparing Q1 year-on-year results, despite a +15.9pp occupancy increase, Average Room Rate and RevPAR has decreased significantly (-49.2% and -34.3% respectively).
Due to the nature of business (rates offered during staycations, isolation facilities, rates for QOs and SHNs at dedicated facilities) being lower, it has resulted in lower Revenue Per Available Room (RevPAR) and Average Room Rate (ARR), despite increasing occupancy rates.
With almost-zero international travel demand, and similar supply levels, room rates are bound to drop. Eventually, when borders reopen, hospitality REIT distributions will rebound back to pre COVID-19 levels.
Below is the Q1 y-o-y comparison of the Net Property Income (NPI) for both REITs.
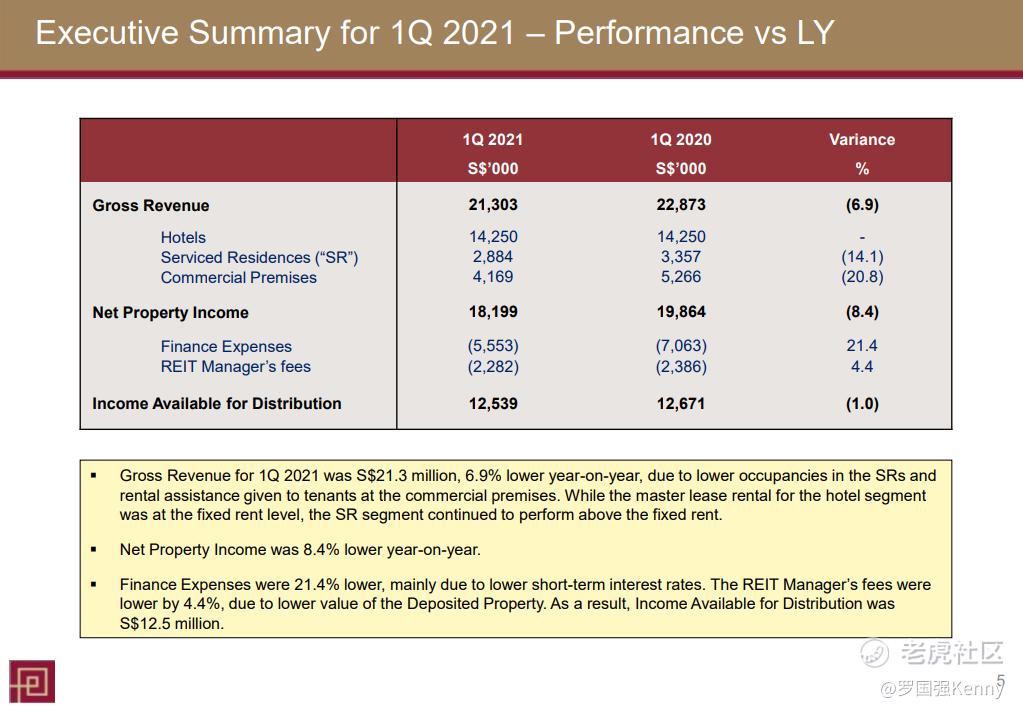
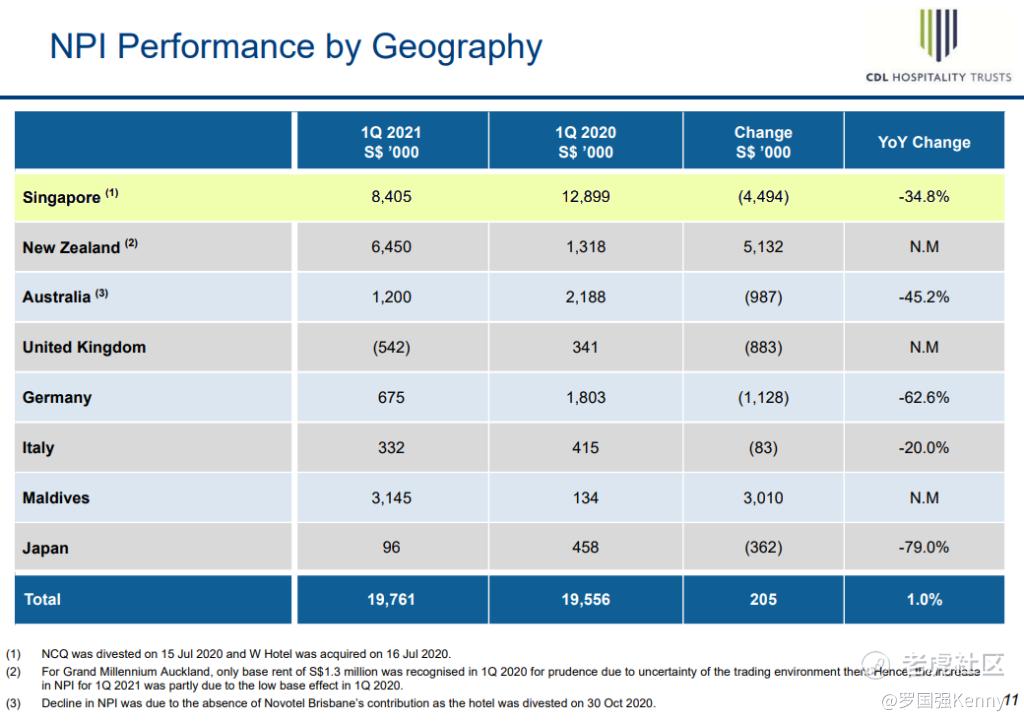
FEHT’s NPI has reported a -8.4% y-o-y change, and CDLHT’s NPI for Singapore properties reported a -34.8% y-o-y change. This is despite the +10.8pp and +15.9pp occupancy increase respectively in the same period.
2H 2020 vs 2H 2019 Year-on-Year Results Comparison
For further comparion between COVID times and pre-COVID times, delow are slides taken from each REIT’s FY 2020 results release. All comparisons will be made between 2H 2020 and 2H 2019, as Singapore did not experience a lockdown in 2H 2020.
Below are slides taken from each REIT’s FY 2020 results release, showing Occupancy, Average Room Rate (ARR or ADR) and RevPAR changes between 2H 2020 (during COVID) and 2H 2019 (pre-COVID).
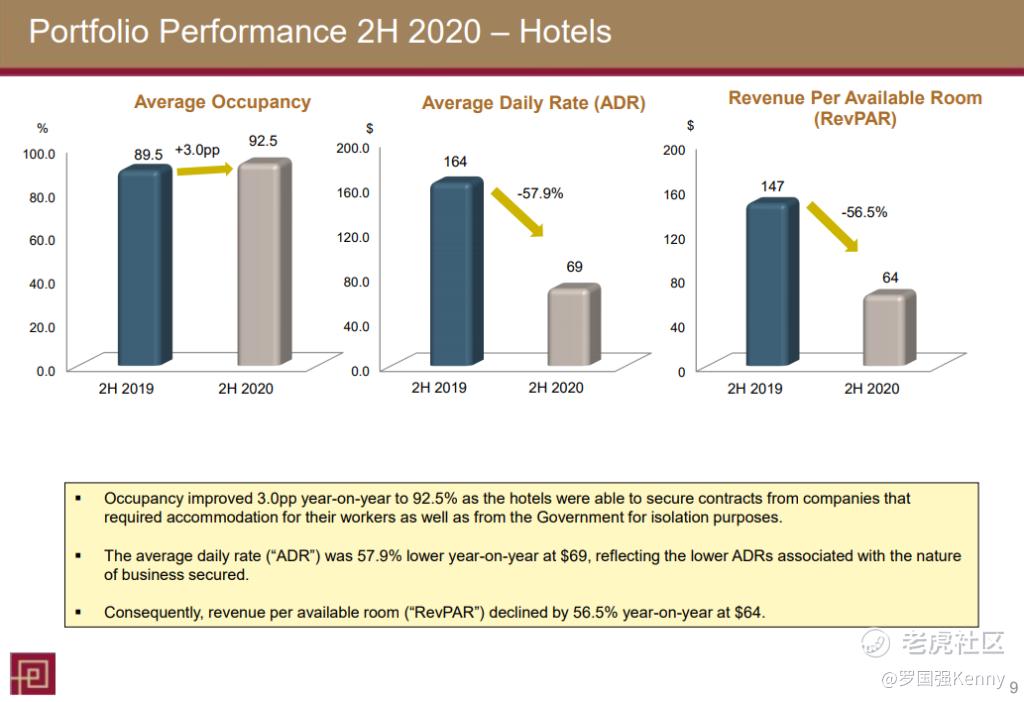
Compared to pre-COVID levels in 2H 2019, occupancy has increased by +3.0pp, yet ADR and RevPAR has decreased significantly (-57.9% and -56.5% respectively).
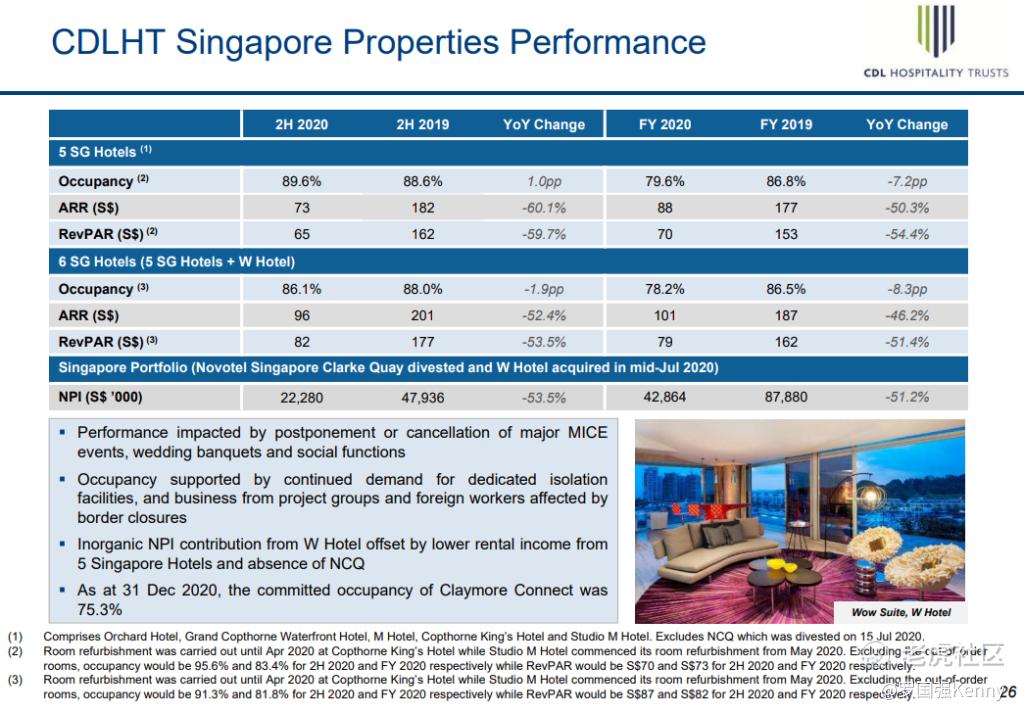
Similar to FEHT’s results, compared to pre-COVID levels in 2H 2019, occupancy has remained similar (small drop of -1.9pp), yet ARR and RevPAR has also decreased significantly (-52.4% and -53.5% respectively).
Below are the 2H 2020 vs 2H 2019 y-o-y comparison of the Net Property Income (NPI) for both REITs.
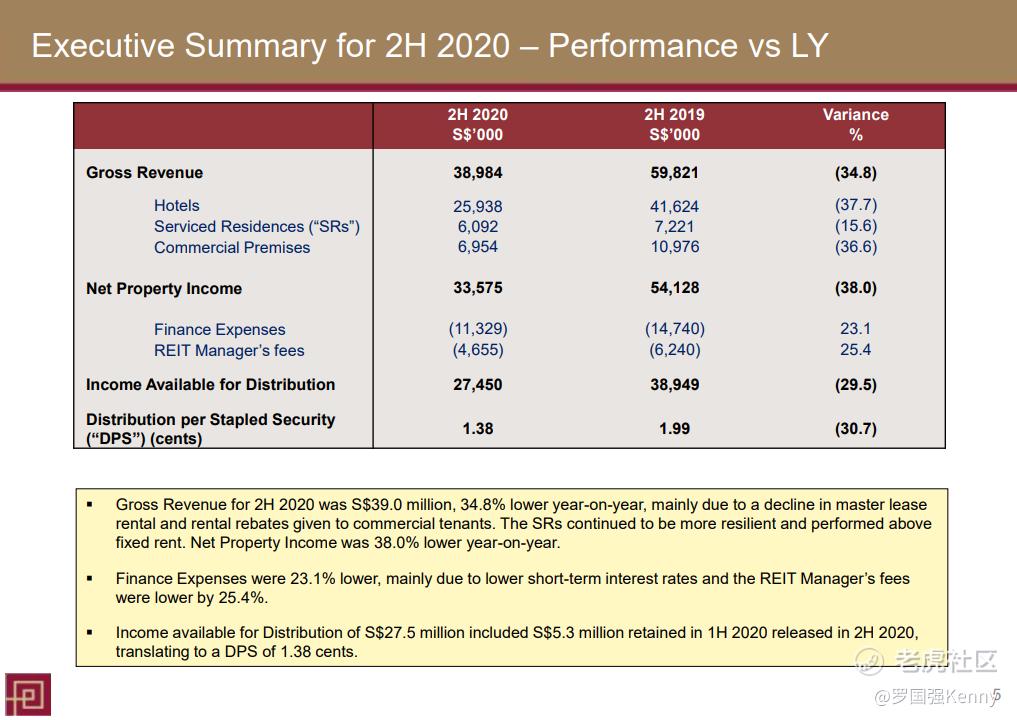
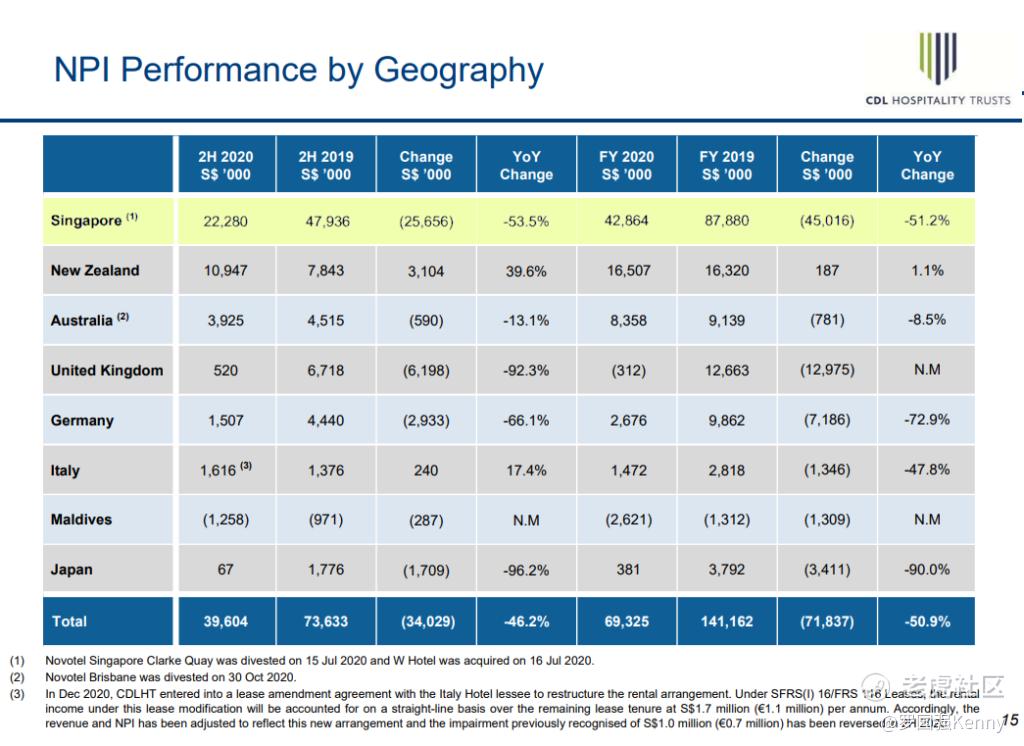
FEHT’s NPI has reported a -38.0% y-o-y change, and CDLHT’s NPI for Singapore properties reported a -53.5% y-o-y change for 2H 2020 compared to 2H 2019. This is despite minimal occupancy changes of +3.0pp and -1.9pp respectively in the same period.
Distribution History for both REITs
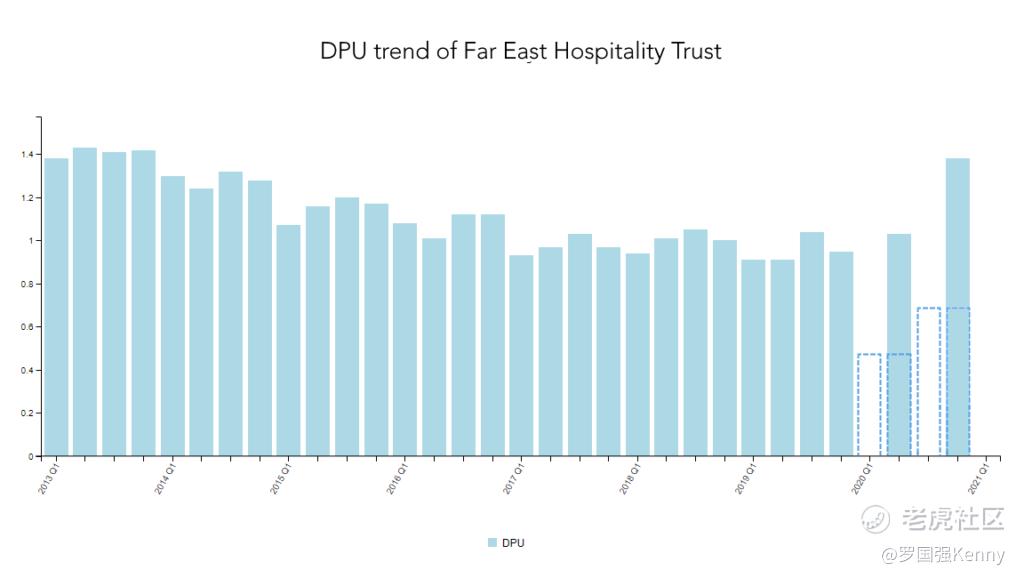
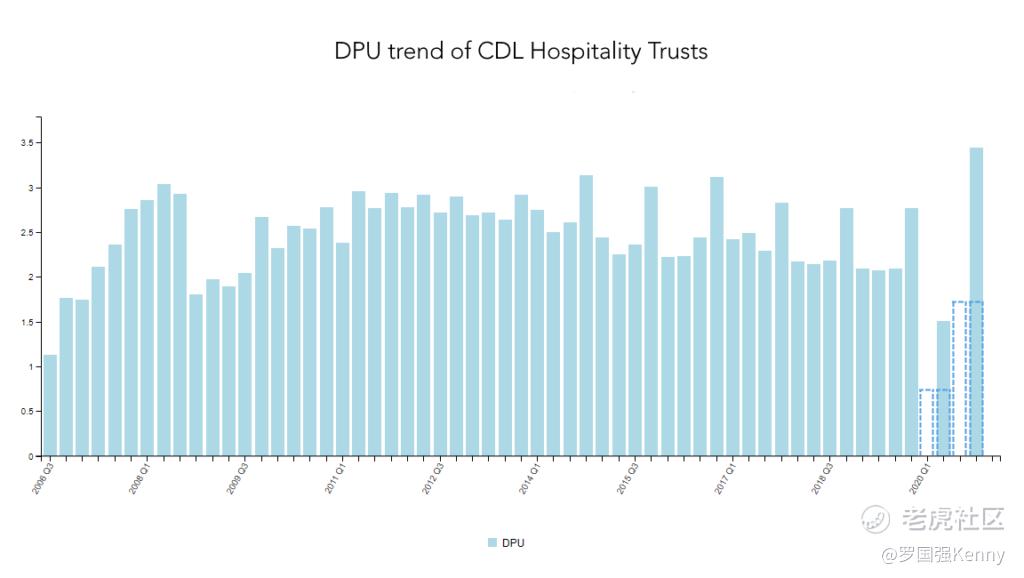
With all this in mind, and without any significant progress made in Q2 2021 in terms of reopening borders and resuming international travel, below are the DPU trends of each REIT. Data is taken from the StocksCafe REIT screener.
Even when the DPU graphs are interpolated to show quarterly distribution, the DPU for FEHT in 2H 2020 has not returned to normal levels, despite Singapore not undergoing a partial COVID lockdown during this period.
Similarly for CDLHT, the DPU for 2H 2020 has not returned to normal levels. This shows that despite high occupancy rates for Hospitality REITs, and government business in the form of SHNs and isolation facilities.
This is not to mention that in Q2 2021, Singapore went into another partial lockdown with gathering size limits of 2(May 16 to June 13 2021), prompting cancellations of staycations with more than 2 guests per roomas they were not allowed.
With all these in mind, even with government quarantine business (e.g. SHN),Hospitality REITs are unlikely to pose an uptick in distribution in Q2 2021.
Kenny Loh is a Senior Financial Advisory Manager and REITs Specialist of Singapore’s top Independent Financial Advisor. He helps clients construct diversified portfolios consisting of different asset classes from REITs, Equities, Bonds, ETFs, Unit Trusts, Private Equity, Alternative Investments and Fixed Maturity Funds to achieve an optimal risk adjusted return. Kenny is also a CERTIFIED FINANCIAL PLANNER, SGX Academy REIT Trainer, Certified IBF Trainer of Associate REIT Investment Advisor (ARIA) and also invited speaker of REITs Sympsosium and Invest Fair.
You can join my Telegram channel #REITirement – SREIT Singapore REIT Market Update and Retirement related news. https://t.me/REITirement
Disclaimer: Investing carries risk. This is not financial advice. The above content should not be regarded as an offer, recommendation, or solicitation on acquiring or disposing of any financial products, any associated discussions, comments, or posts by author or other users should not be considered as such either. It is solely for general information purpose only, which does not consider your own investment objectives, financial situations or needs. TTM assumes no responsibility or warranty for the accuracy and completeness of the information, investors should do their own research and may seek professional advice before investing.

great sharing!