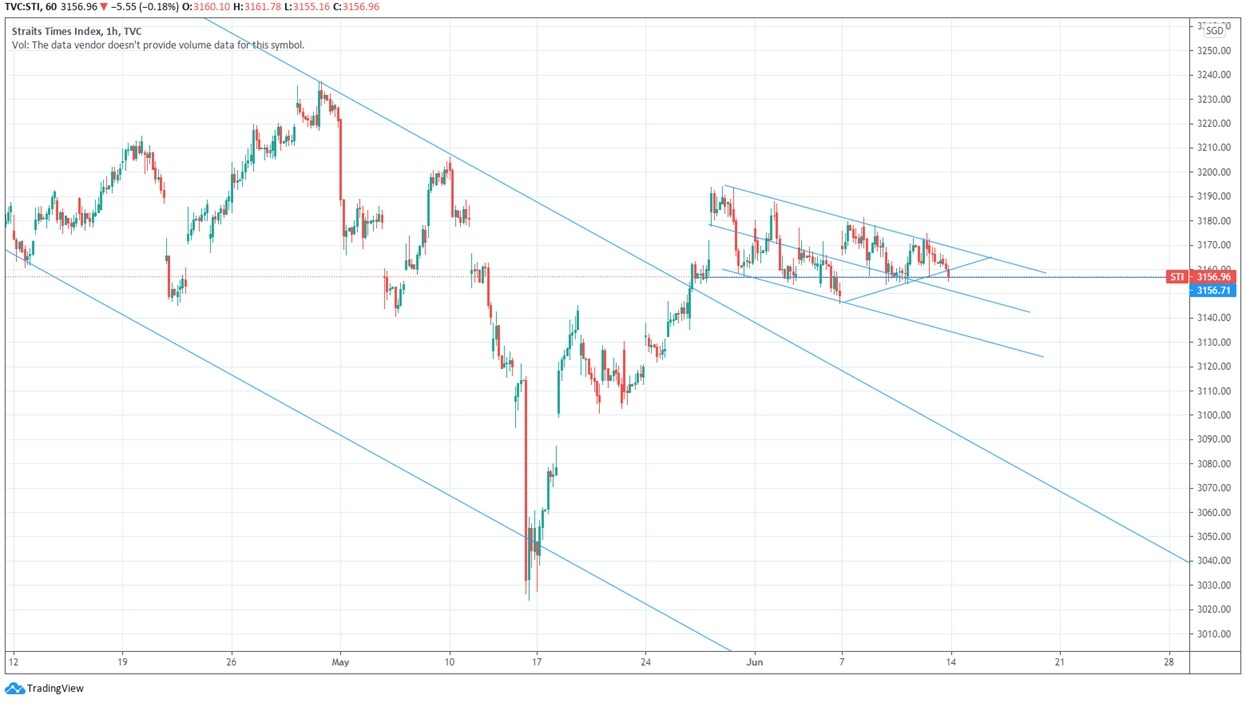
STI Technical outlook based on hourly chart:
- Trading in a downtrend channel since 28 May
- Lower highs (bearish) since 28 May
- Reach the low of 3145 on 4th Jun and has since establish higher lows, forming a triangle pattern.
- Appears to have broken down from the triangle formation during the last trading hour today (bearish)
- Now holding at the horizontal support line
Current TA points towards a bearish bias over the short term. STI may move towards its next support at 3145, which is also around the mid-line of the downtrend channel.
What it takes to turn bullish?
STI has to break up from the downtrend channel and clear the previous high of 3175.
Trade with care and DYODD.
Disclaimer: Investing carries risk. This is not financial advice. The above content should not be regarded as an offer, recommendation, or solicitation on acquiring or disposing of any financial products, any associated discussions, comments, or posts by author or other users should not be considered as such either. It is solely for general information purpose only, which does not consider your own investment objectives, financial situations or needs. TTM assumes no responsibility or warranty for the accuracy and completeness of the information, investors should do their own research and may seek professional advice before investing.
- shawnhuat·2021-06-14yesLikeReport