Irrational Exuberance!
The Speculative Orgy Is Gripping The Markets!

“Clearly, sustained low inflation implies less uncertainty about the future, and lower risk premiums imply higher prices of stocks and other earning assets. We can see that in the inverse relationship exhibited by price/earnings ratios and the rate of inflation in the past. But how do we know when irrational exuberance has unduly escalated asset values, which then become subject to unexpected and prolonged contractions as they have in Japan over the past decade?”- Alan Greenspan; December 5, 1996.
One of the longest-serving Fed Chair, Alan Greenspan, coined the term “Irrational Exuberance” in the run-up to the most significant stock market bubble in 2001, the “Dot-Com Bubble”.
The shock from the stock market crash in 2001 was so profound that the ensuing negative wealth effect caused a mild recession in the world’s largest economy.
Nevertheless, the 2001 recession was unique as the housing sector remained resilient while the economy contracted; and NBER declared a recession.
Though many books cover the boom and bust cycles, my favourite book remains “Irrational Exuberance” by Robert J. Shiller, who ironically published it at the pinnacle of the speculative orgy in 2000.
PS: A year back, I wrote Anatomy of a Bubble (Part 1) and Anatomy of a Bubble (Part 2) For those who want to understand more about bubbles, do give it a read.
One must appreciate that Robert J. Shiller is one of the most respectable economists who created the Case-Shiller Index in the 80s and popularised the Shiller P/E Ratio.
Fed’s fastest pace of monetary tightening busted the loss-making tech bubble last year as valuations crashed in the private and public markets.
Nonetheless, some of the sections of the stock markets are now exhibiting probable signs of a “bubble” as ample liquidity emanating from CBs and technical domestic factors in the US distorts the reality in “stonks”.
Let us dig in and find the frothy areas of stock markets in the US and comprehend what’s happening in the global stock markets.
The US Markets!
SHILLER CAPE RATIO
Shiller developed the Cyclical Adjusted PE Ratio or the CAPE Ratio, which is derived using the “real” EPS over ten years.
As per Shiller, this helps to smooth out fluctuations in corporate profits that emerge over different periods of the business cycle.
When we zoom out the chart commencing from the 1900s, the mean of the CAPE ratio comes out to be around 17.44
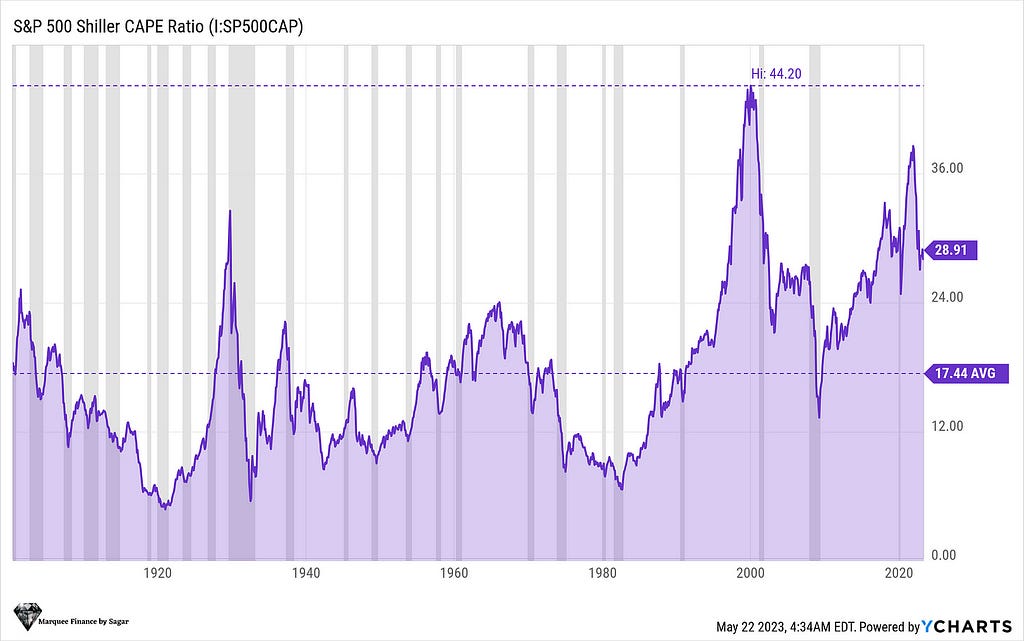
Nevertheless, when we take the period from 1990–2023, the mean comes out to be close to 26.45. The current valuation is 28.91, a 10% premium from the mean of the last three decades.
PS: I took 1990–2023 because this was when Greenspan launched the Fed put, and the interest rates were on a long-term downward trajectory.
Clearly, the two periods where the valuations as measured by the CAPE were exceptionally expensive were 2001 (dot com bubble: 44.20) and 2021 (post covid: 39).
The noticeable fact is that rangebound markets succeeded in peak CAPE ratios for years and sometimes decades.
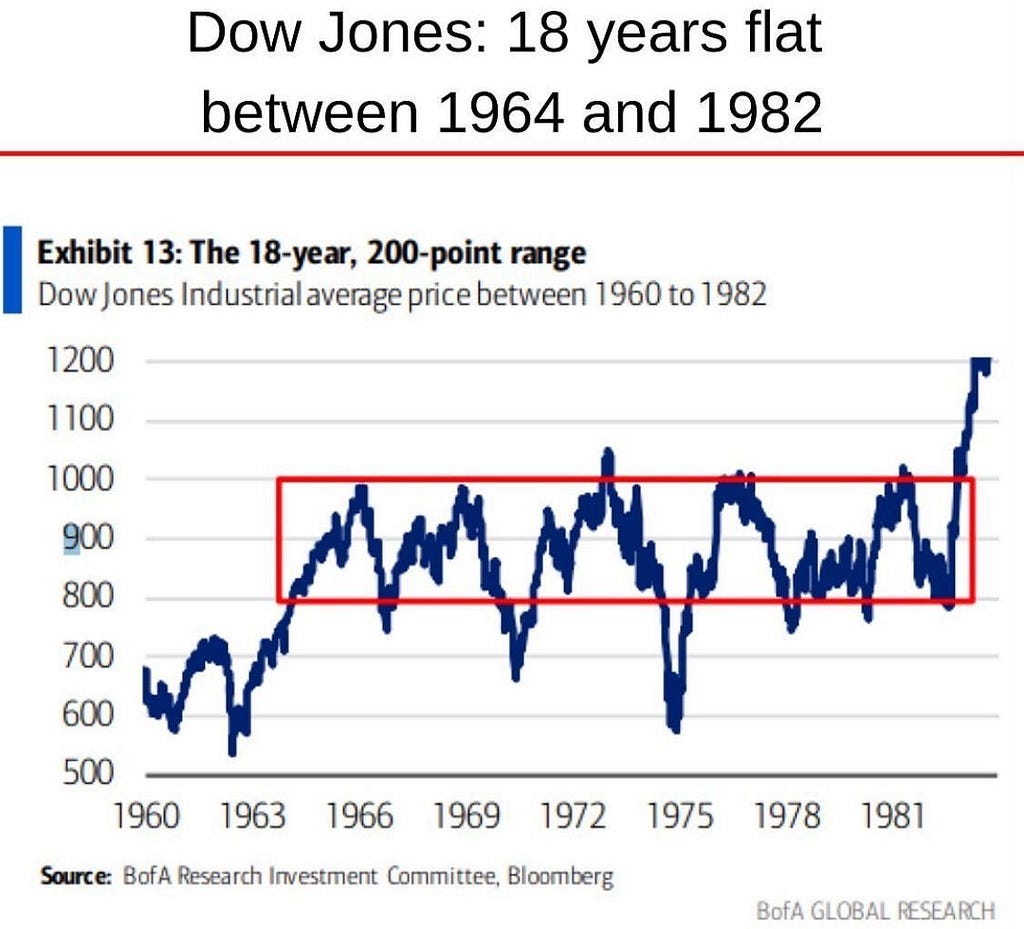
This is an intriguing piece of information since peak demographics, stagflation, and higher nominal earnings characterised the period from the 1960s to 1982.
Nonetheless, at the juncture when Volcker raised the FFR to 20%, the CAPE ratio bottomed out, and the markets rallied stupendously post the end of the stagflationary period.
Our CAPE ratio analysis infers that there is a “considerable” probability of an occurrence where the index trades in a broad range in the near future (2–4 years).
EQUITY RISK PREMIUM
Cross-asset investors’ preferred criterion to gauge the appeal of equities over “risk-free” assets or sovereign bonds is the equity risk premium.
Investors always demand an excess return to invest in “risk” assets such as equities.
Generally, the thumb rule is that as the equity risk premium shoots up, the markets are cheap, and the funds flow from bonds to equities and vice-versa.
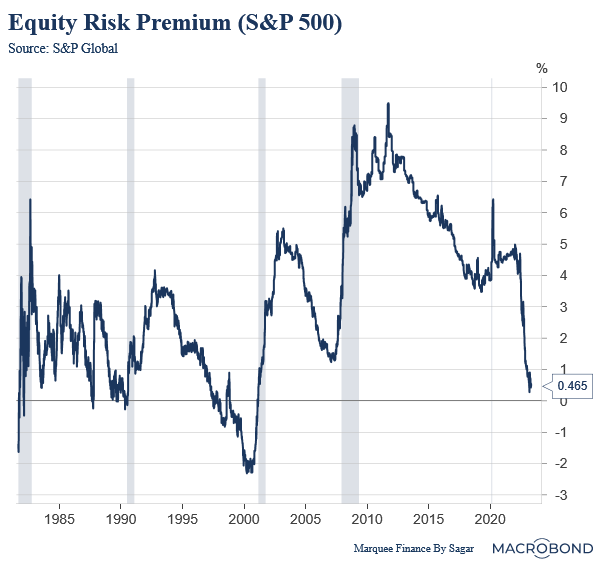
Here, I calculated the S&P 500 equity risk premium by deducting the 6-Month T-Bill from the S&P 500 earnings yield (Inverse of PE); the results are startling.
During the 2001 bubble, a mind-boggling development transpired as the equity risk premium turned negative!
With the Fed chalking on the path of one of the most rapid monetary policy tightening and as the earnings yield skyrockets (lower PE), the equity risk premium has plunged to the lowest since the dot-com bubble.
As a result, flows have turned negative for equities while investors turn overweight on bonds and cash.
Furthermore, recession risks are frightening and driving investors to “safe” assets leading to the most Overweight position on bonds since the 2008 GFC.
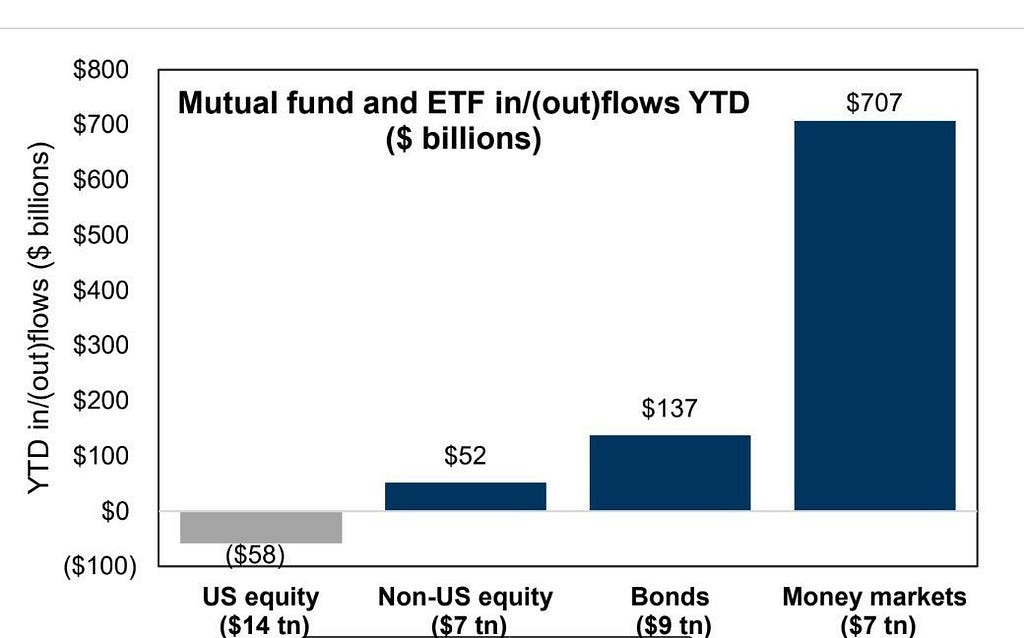
PS: MMFs should be considered as a proxy for “cash”.
REAL YIELDS AND MARKET BREADTH
Since the Fed began tightening the monetary policy last year, real yields have been negatively correlated with the NASDAQ performance.
Arguably, higher real yields make bonds more attractive than risky tech stocks.
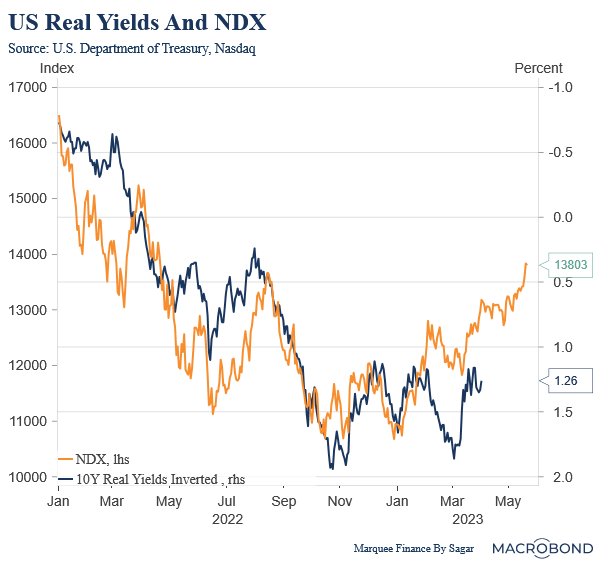
Nevertheless, the negative correlation between the two seems to have broken in the last two months.
Removing all the biases and acting rationally, optimist investors/bulls believe that the NDX has been rallying despite higher real yields as investors flock to safe haven “big tech stocks”.
Bears argue that the move is not the flight to safety but a result of the “AI” maniawhich leads to investors being irrational and creating another bubble in the name of initiating a “new era”.
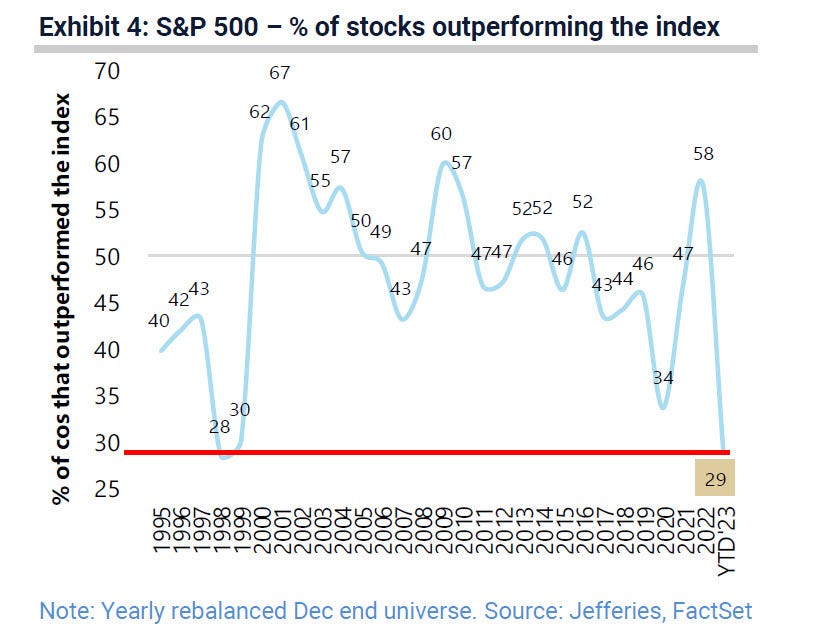
One point that both bulls and bears would agree on is that a handful of stocks (really poor market breadth) leading the index higher doesn’t start a new bull market.
So, the question arises: Is the AI-led stock rally sustainable?
Well, stock prices are a function of future growth prospects and earnings. Though undoubtedly, the AI potential is too big to ignore.
However, one needs to be careful after the catastrophe that META 3.39%↑ faced with Metaverse. If one believes that Artificial Intelligence can generate billions of dollars of revenue in the next few years, then it could easily be EPS accretive, and a part of the current rally can be justified.
Nonetheless, I believe that significant capex will need to be incurred before any material revenue generation is realized from AI.
Even after the addition to the top line, one can’t be sure that the initial boom will be a sustainable long-term trend as significant headwinds remain regarding regulation and ethical concerns (especially after the fake Pentagon bombing episode).
In fact, we are now reaching a point where some AI beneficiaries’ valuations are reaching frothy levels.
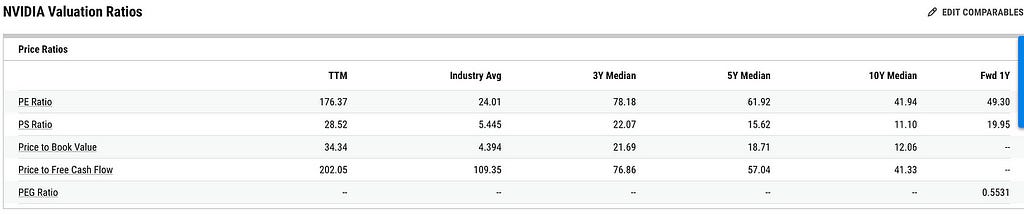
NVDA 2.14%↑ is trading at an exhilarating 28.5X PS and 176X PE. Furthermore, even mega-cap stocks like MSFT 2.41%↑ added billions of dollars of market cap on the AI news.
MARKET INTERNALS
When we dig deeper into markets, the story is identical.
While SPY 1.13%↑ has been holding out pretty well, the small-cap index Russell 2000 is portraying a horrifying picture.
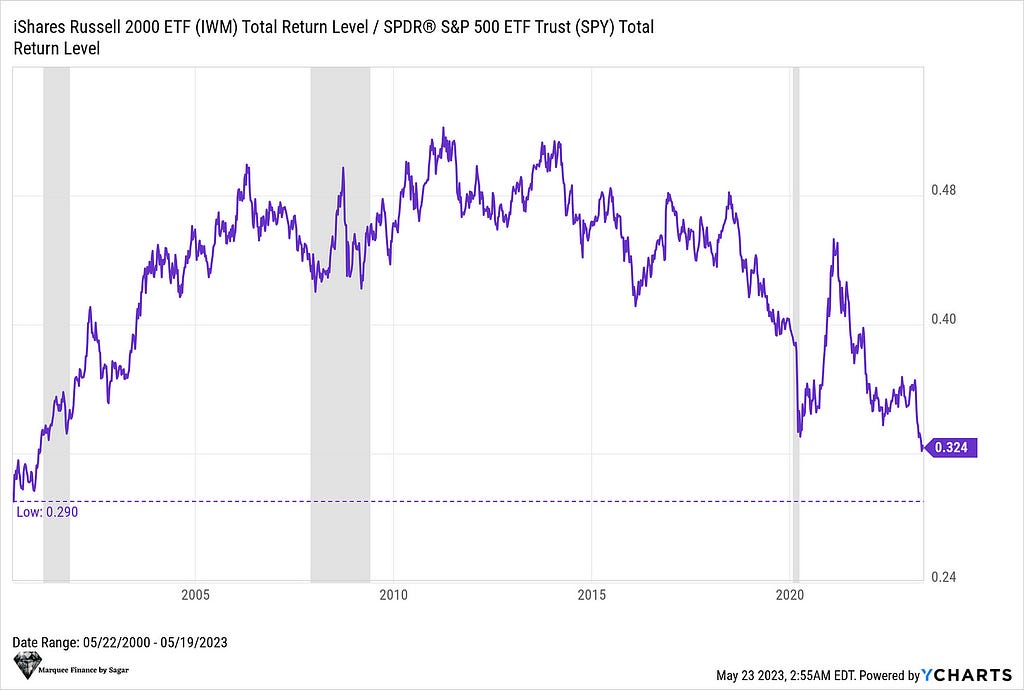
IWM has massively underperformed the SPY since the beginning of the year, and the ratio has now reached dangerously close to the dot-com bubble.
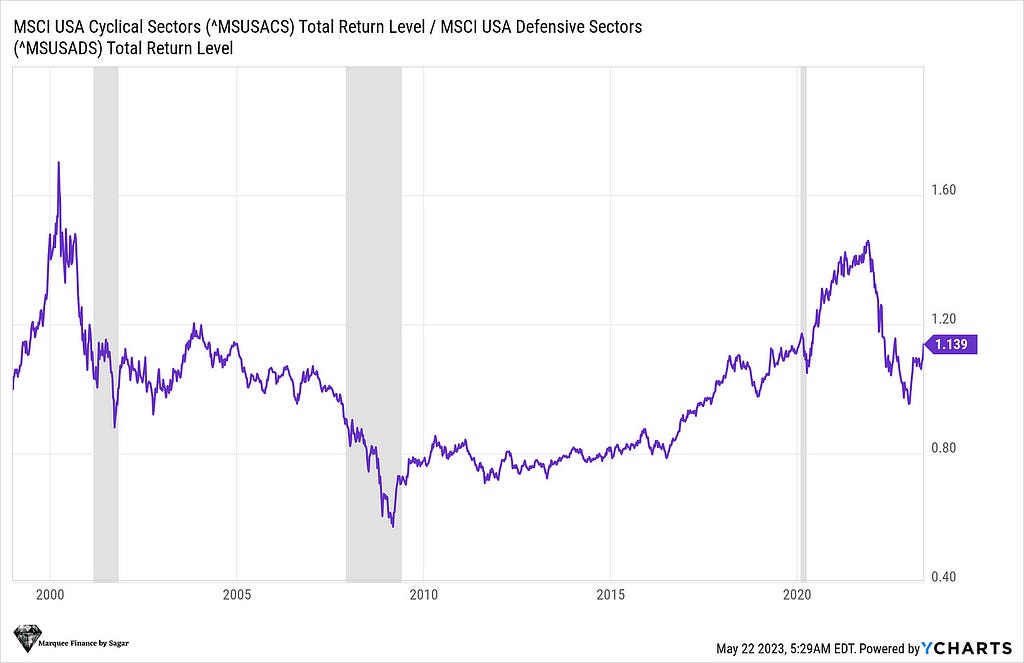
Furthermore, markets have long positioned for the most anticipated recession of our lifetimes. As a result, defensives were outperforming the cyclical all through Q123.
However, even that flipped in the last two months as cyclical outperformed the defensive sectors betting on a “soft landing”.
Japan And Europe!
Japanese stocks have undergone a fierce bull market rally in the last couple of days and have reached fresh 33-year highs.
Many factors are contributing to the rekindled interest in one of the most overlooked equity markets.
As investors look for opportunities outside the US, Japan is a compelling option for those looking for a stable income.
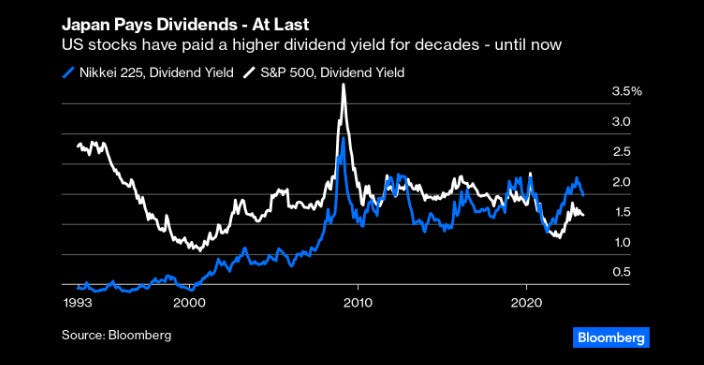
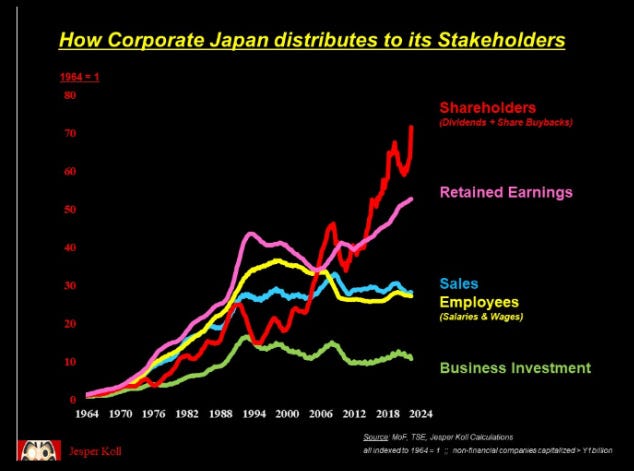
The corporate culture is now transforming across Japanese companies as corporations flush with cash resort to buybacks and dividends to return money to shareholders.
Furthermore, Buffett’s endorsement gave a sentiment booster to Japanese stocks.
Turning to Europe, as China reopened in early December and the natural gas prices collapsed by more than 90%, European stocks turned the darling of investors, and the DAX reached an all-time high this week.
The strong growth in nominal earnings and resilient consumption is helping stocks. However, the recent manufacturing data and GDP numbers are not so rosy.
The sentiment is weakening across the cyclical part of the economy, and one needs to be cautious going forward.
Nevertheless, defensives can still outperform the cyclical in Europe.
Conclusion!
All in all, we can conclude the following about the US markets:
- The index is expected to trade in a broad range for years to come. Any breakout on either side will be a buying/selling opportunity.
- Certain pockets of markets resemble a “bubble”, and valuations are indeed frothy.
- The broader market remains weak and is expected to stay due to the heightened risks about CRE, regional banks and losses emerging from the labor market.
- Equity flows remain muted, and investors keep piling on bonds in anticipation of lower rates due to a looming recession.
Japan remains the most preferred developed market for investors as cheap equities and optimism about substantial growth in nominal earnings drive one of the biggest rallies this year.
European equities also touched new highs this week. However, one should be wary of putting fresh money at these levels as the road looks bumpy ahead.
As I mentioned in my Global Outlook for 2023, the equities in the Rest of the World (RoW) look reasonably positioned than the US.
Subscribe to DDIntel Here.
Visit our website here: https://www.datadriveninvestor.com
Join our network here: https://datadriveninvestor.com/collaborate
Irrational Exuberance! was originally published in DataDrivenInvestor on Medium, where people are continuing the conversation by highlighting and responding to this story.
Disclaimer: Investing carries risk. This is not financial advice. The above content should not be regarded as an offer, recommendation, or solicitation on acquiring or disposing of any financial products, any associated discussions, comments, or posts by author or other users should not be considered as such either. It is solely for general information purpose only, which does not consider your own investment objectives, financial situations or needs. TTM assumes no responsibility or warranty for the accuracy and completeness of the information, investors should do their own research and may seek professional advice before investing.
- Tigaa·2023-05-31okLikeReport
- aozora·2023-05-31YesLikeReport
- hu1250·2023-05-31KLikeReport
- Mushroomyyy·2023-05-31okLikeReport
- sokoon0121·2023-05-30FdfLikeReport
- keane3921·2023-05-30GdLikeReport
- Gnay·2023-05-30okLikeReport
- RollingPolli·2023-05-30👍🏼LikeReport
- NewbieLeo·2023-05-30thanksLikeReport
- Tiger Lim·2023-05-30GoodLikeReport
- Tiger Wong·2023-05-30GoodLikeReport
- Runderk·2023-05-30GoodLikeReport