The Shakeout
Is The Inflection Point Near?

The first week of every month is the most important for macro traders/investors as we get the critical data that the central banks all around keep a close watch on.
The bond and equity markets react violently as rates expectation swiftly moves , and the equity markets “generally” follows the credit markets (barring episodes when the liquidity Tsunami rules the streets).
This week was quite eventful across asset markets as the 10Y yield in the West created havoc. In the UK, yields ripped as persistent core inflationary pressures led to markets pricing in a 6.5% terminal rate, significantly higher than the US.
In the US, the 10Y is back to the levels seen before the SVB demise in March. As the labour market data surprises on the upside, the odds of a rate hike in “November” has risen considerably.
With the “shakeout” in the bond markets and a significant drop in Central Bank liquidity, an interim top in equities has seemed to materialise.
Let’s understand, with super interesting charts, the data dump of the week!
US Macro Data!
This week, we got the all-important ISM data and the closely watched Non-Farm Payrolls (NFP) data.
ISM Manufacturing, the best metric to gauge cyclical activity, is the favourite leading indicator for macro traders/investors.
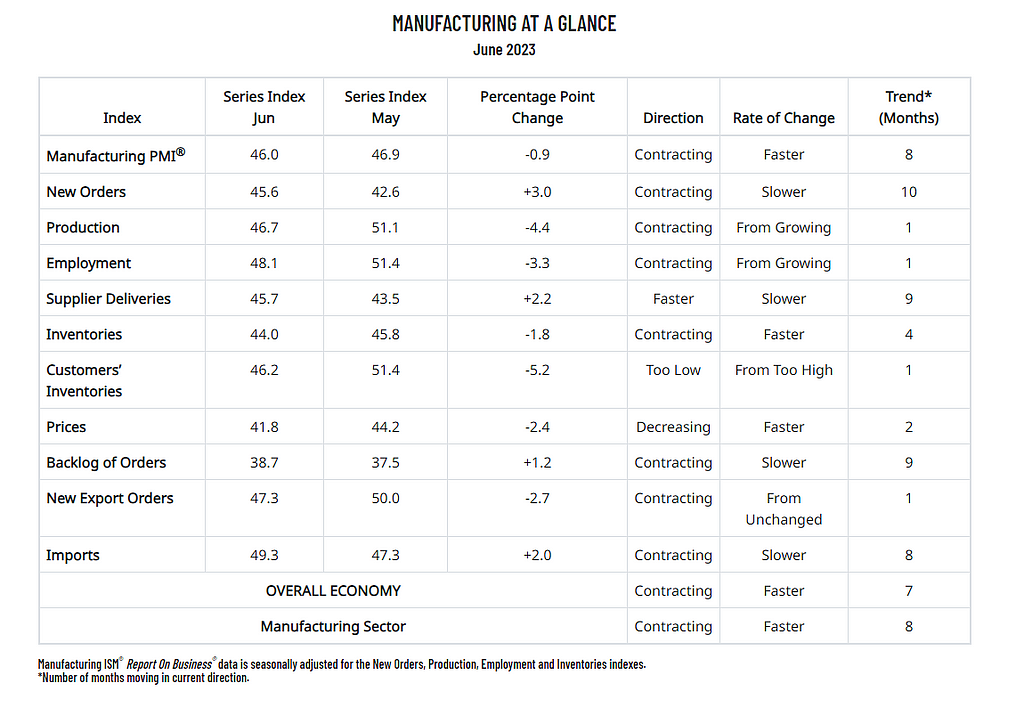
One of the astounding facts about this month’s ISM Manufacturing data was that all the sub-components are in the contraction territory (below 50), a rare phenomenon often seen during recessionary periods.
The New Orders Less Inventories have been my preferred gauge. Digging deeper, we find that it leads the headline ISM number by 3–4 months.
New orders rebounded sharply from its low but remained in the contraction territory.
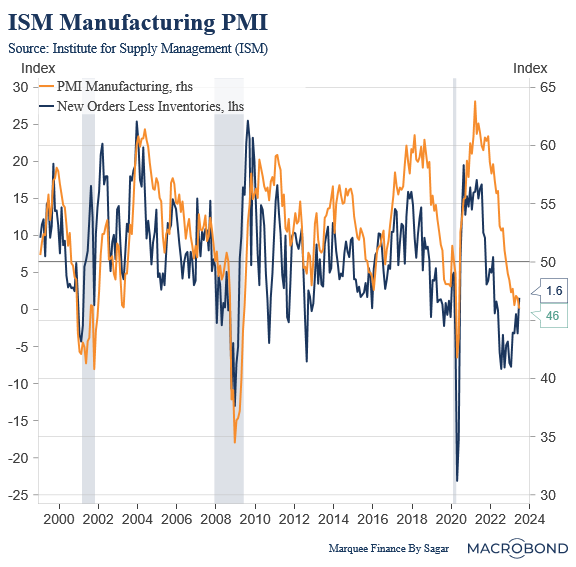
There are early signs that New Orders Less Inventories bottomed out in Jan-Feb. The bulls use this pretext to justify the “soft landing” and the “Goldilocks” scenario, thus pumping the risk assets.
Nevertheless, we can see that such “dead-cat” bounces have preceded all the recessions. In 2008, we can see the bounce even during the recession.
Why is ISM super important for equity investors?
Well, the answer lies with the near-perfect track record of falling/recovering ISM with equity returns.
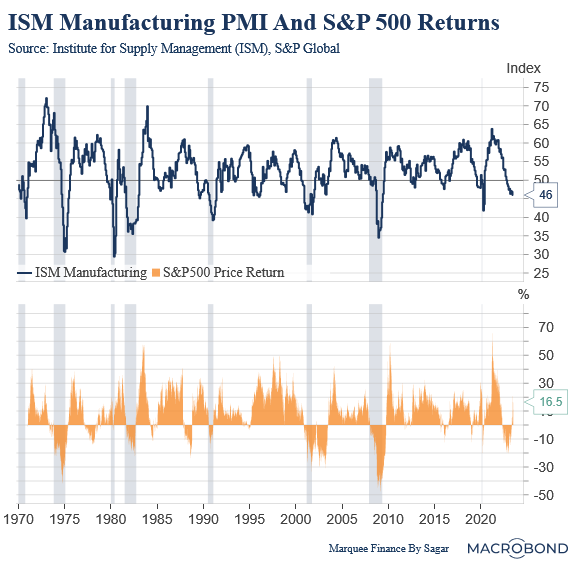
We can safely conclude that whenever ISM bottoms out and rebounds to above 50, the S&P500 gives positive YoY returns.
Furthermore, in all the recessions since the 70s, ISM has bottomed at or below 40 levels. We need to appreciate that we are still at 46 levels.
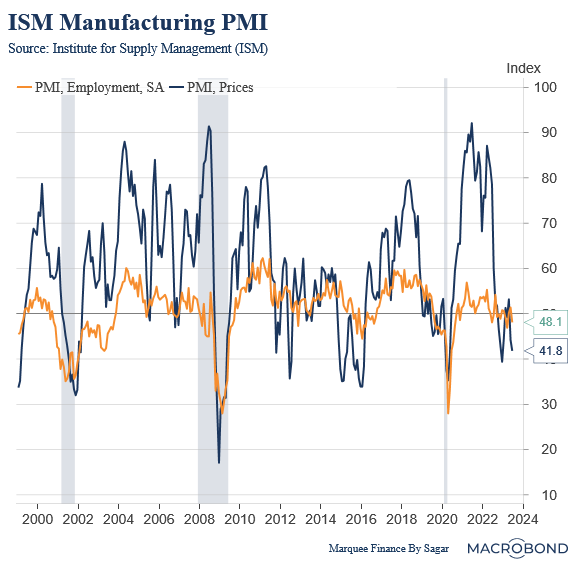
The ISM has not collapsed to 40 or below levels due to the two most resilient components: Employment and Prices.
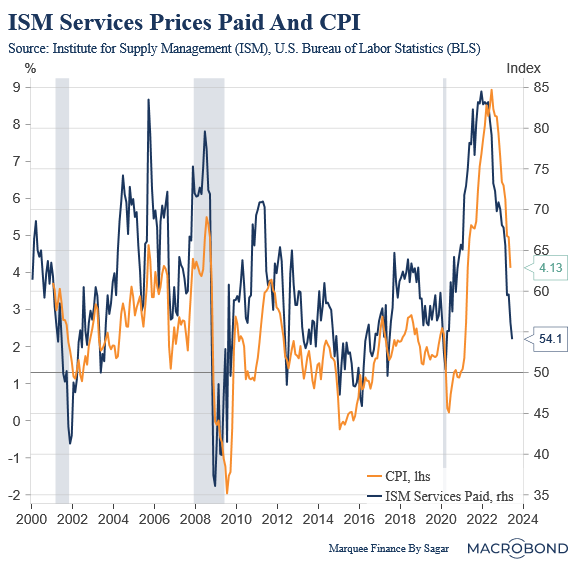
Lately, as inflation has cooled off, ISM Prices have plunged and now seem to be in a confirmed downtrend. Healing supply chains have been one of the most significant factors for the decline.
Even the ISM Services confirm the downward trend in inflation; if ISM Services is believed, we may see a 2% handle on headline number in H2.
Though, I still feel there is a high probability of inflation rebounding.
On the contrary, the ISM Manufacturing Employment component has seen various flip-flops since the Fed began raising rates. With the labour market indicating initial signs of softening, the employment component should begin its drop soon.
In prior recessions, where the Unemployment Rate (UR) rose sharply, the ISM Employment bottomed at 38 and below. We are far off from that level.
I have repeatedly reiterated that the labour market is the key to the Fed’s action, especially in an election year.
Let us decode some of the nuances of the labour market.
The initial jobless claims is a volatile series and subject to revisions. Thus, many economists look out for continuing claims as the leading indicator for the labour market’s health.
Nevertheless, we will analyse both the initial and continuing claims.
Initial claims have risen recently and are now modestly above the pre-pandemic levels.
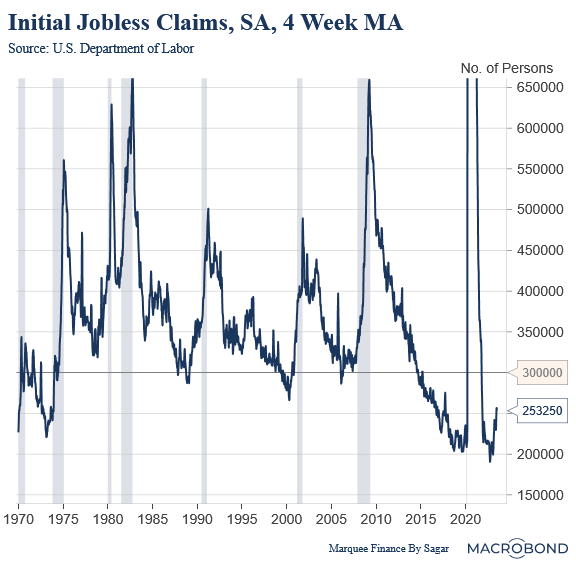
Though coming from a very low base, the YoY change is in double digits and predicts an imminent recession.
However, the fact of the matter is that unless we get a 300k reading consistently and a rising trend, the labour market will fail to break.
Coming to the super important continuing claims, there is a significant relationship with the 2s10s yield curve.
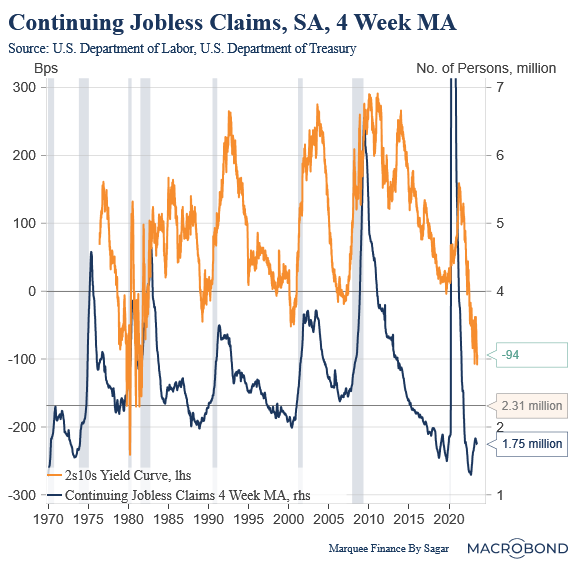
The continuing claims have moved sideways after a steep rise post the SVB fallout in March. The current number is hovering around 1.75 million. To be in cognisance of a recession, the continuing claims need to rise to at least 2.31 million, which is a whopping 40% rise from the current levels.
As soon as the continuing claims skyrocket above 2.31 million, the steepening of the curve will also pick up pace, and with steepening comes a sure-shot correction in risk assets.
The NFP data is also a highly volatile series and marred with birth-death adjustments making it less reliable than the claims data. However, the first time NFP came below expectations since Jan 2022, indicating softening of the labour market.
Nonetheless, the gap between the unemployed and vacancies is still too large. It needs to be comfortably at the pre-pandemic levels before we see wages cooling to the 2–3% mark from the current 4%+ as measured by the AHE (Average Hourly Earnings).
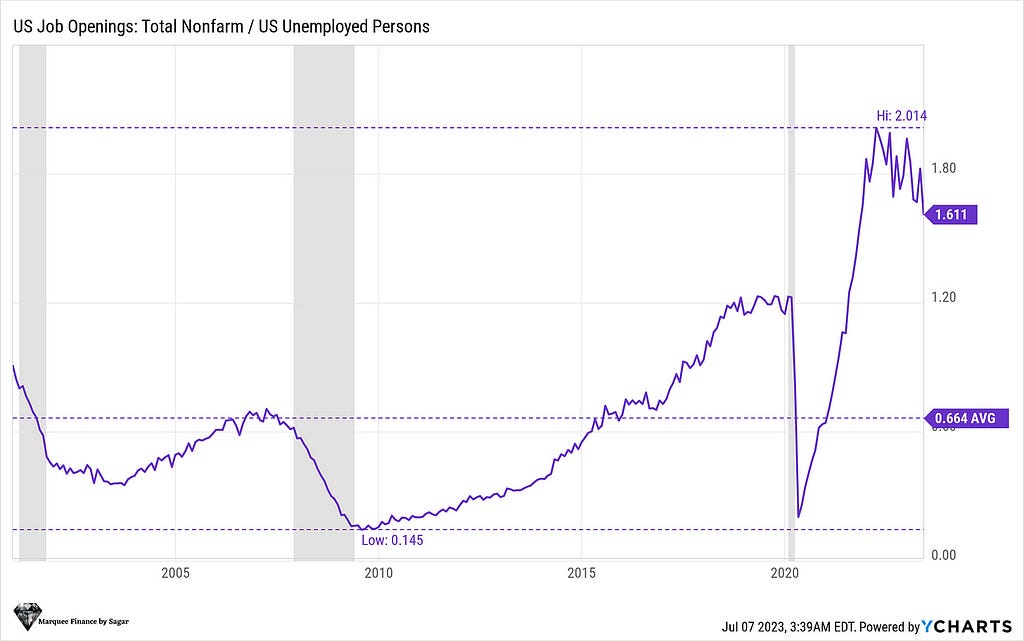
PS: This chart is the favourite of JayPo, as he has mentioned it multiple times when talking about the labour market and maximum employment.
Europe and Asia!
Euro Area manufacturing PMI is in a confirmed downtrend and reached a new cycle low of 43.4. The cyclical activity is fast contracting as demand collapses and higher interest rates bite into corporate profitability.
The surprise, however, was the services PMI, which cooled off from above 55 levels to 52 levels. (though still in expansion territory)
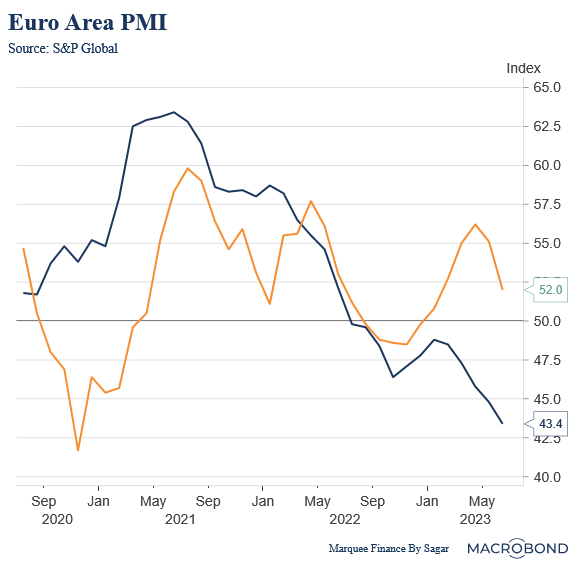
Despite a resilient labour market, a fall in services PMI demonstrates waning consumer confidence.
As we know that monetary policy transmission acts with a considerable lag, the European Households (HHs) are now reeling under the massive squeeze of disposable incomes. As a result, the services demand is moderating.
On the inflation front, the EU PPI gave in a first negative print since 2020, thanks to the plunge in energy prices.
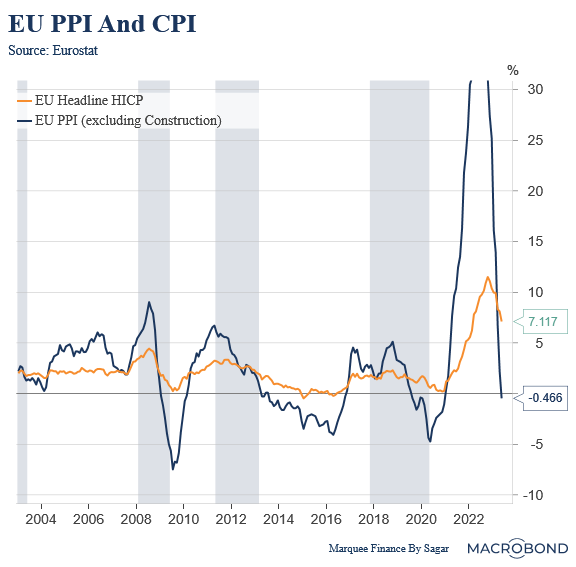
Hopefully, the headline CPI will follow the PPI and move down considerably to the 4% mark from the now-hot 7%.
Nevertheless, with super-hot wages and labour shortages rampant, the core CPI might remain sticky, and the road to the 2% path is bumpy even per the ECB’s projections.
In the East, China’s troubles keep on mounting. While the manufacturing PMI is in contraction mode, the services PMI was a complete shocker.
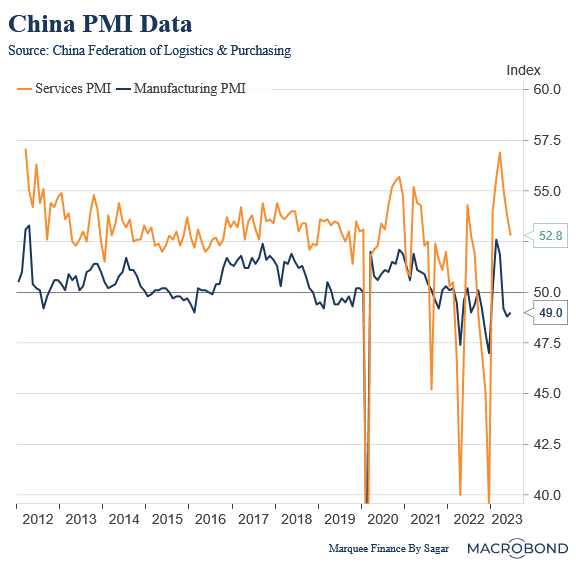
The epic Chinese reopening has been miserable, and with urban youth unemployment crossing 20%, the consumer sentiment is taking an enormous hit even with trillions of yuans of savings.
The services PMI declined to 52.8 and may fall into contraction territory (below 50) soon. The Chinese economy now needs sustained fiscal stimulus to drive economic growth.
The signals are all over the place that the Japanification of the Chinese economy is accelerating, which is a bad omen for commodities.
Conclusion!
USA:
- With softening Employment and Prices component, ISM Manufacturing surprised on the downside. Though, the New Orders less Inventories indicate a likely bottoming out.
- The current signal in New Orders less Inventories is a dead cat bounce which might be “transitory” before ISM Manufacturing resumes its downtrend and breach the key 40 mark by the end of the year or Q1 24.
- The labour market remains the key and is indicating initial signs of softening.
- The continuing claims data, the essential tool for traders/ investors as it’s closely linked with the yield curve inversion, remains stagnant as of now.
- Vacancies/Unemployed remains elevated, and we need the UR to move up to 5%+ before it normalizes to the pre-covid trend.
Europe:
- Europe is vulnerable to a hard landing as the economy is on weak footing, and the cyclical activity remains subdued and is on the way down.
- The services economy, which has been resilient, has started to moderate.
- The epic HH squeeze is coming to Europe, leading to a nasty fall in consumer demand.
- The silver lining is the high gas storage levels which will help this winter even if the weather turns extreme.
- UK’s housing activity has collapsed as a higher share of variable mortgages hit consumers hard.
China:
- The Chinese economy is the most concerning for macro investors.
- The negative surprise in data continues as consumer confidence remains way below the pre-pandemic levels.
- The economy needs persistent fiscal stimulus to avoid deflation and to achieve positive GDP growth.
Overall, global growth is slowly drifting into recessionary territory. Ignoring the significant headwinds, risk assets are moving sideways as risk-free assets witness unprecedented sell-off.
The Shakeout was originally published in DataDrivenInvestor on Medium, where people are continuing the conversation by highlighting and responding to this story.
Disclaimer: Investing carries risk. This is not financial advice. The above content should not be regarded as an offer, recommendation, or solicitation on acquiring or disposing of any financial products, any associated discussions, comments, or posts by author or other users should not be considered as such either. It is solely for general information purpose only, which does not consider your own investment objectives, financial situations or needs. TTM assumes no responsibility or warranty for the accuracy and completeness of the information, investors should do their own research and may seek professional advice before investing.
- Xian789·2023-07-12😊LikeReport
- Hosay_hosay·2023-07-12[Miser][Miser]1Report
- mathslover74·2023-07-12GgLikeReport
- Tig888·2023-07-12PLikeReport
- Zivcheah·2023-07-12PLikeReport
- ahboyyy·2023-07-12[Happy][Happy][Happy]1Report
- 雨点尔·2023-07-12ok1Report
- kytphine·2023-07-12thanks1Report
- Tiramisu2020·2023-07-12coolLikeReport
- Cxxxx·2023-07-12okLikeReport
- HJlee·2023-07-12okLikeReport