The “Fairytale” Landing!
The “Narratives” Point To An Implausible Scenario!

“Once in a while, right in the middle of an ordinary life, God gives you a fairytale.”- Unknown.
The human mind is designed to concentrate exclusively on a few things at a particular time. If you inundate it with a flood of narratives: the result is confusion which leads to an erroneous decision, thus benefiting those who spread those narratives.
The current narrative being promoted by the who’s who of the finance world is the imminent “soft landing” (inflation will be brought under control without sacrificing growth and keeping a lid on the unemployment rate) that the US economy will undergo. The social media biggies have forgotten the words JayPo echoed last year during the Jackson Hole.
Friends, I would like to remind you about JayPo’s statement:
“While higher interest rates, slower growth, and softer labour market conditions will bring down inflation, they will also bring some pain to households and businesses.”
Risk assets are partying like never before, thanks to the buoyant liquidity still sloshing around the system.
Nevertheless, it’s time to be cautious as Fed has some unfinished business left, and the variable lags have distorted the true macro picture and led us to believe that we have got a “fairytale” landing in sight.
Let us understand the economic data and the lags in the housing market to understand the economy’s direction!
US Economic Data And Housing Deep Dive!
Since we had the portfolio update last week, we didn’t get the time to discuss the uber-important CPI data, which triggered an enormous rally in risk assets on the false hopes of a “soft landing”.
While the headline print came in at 3%, the supercore inflation, which the Fed tracks closely, also demonstrated initial signs of plateauing.
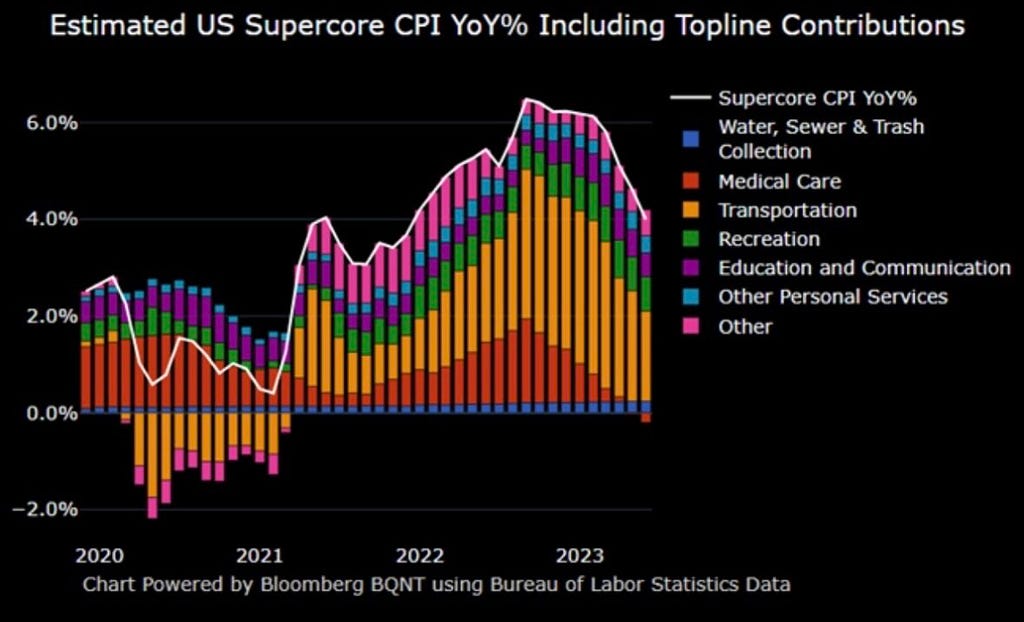
One of the surprises was the negative contribution of Medical Care which will get reversed in October due to some methodological changes (market participants expect an increase of up to 2–3%), which will act as a tailwind for higher inflation.
Furthermore, the base effect, as we predicted, will wane off from July onwards. There is a high probability that the second bout of inflation will transpire before the end of the year as the positive wealth effect leads to higher spending and supports the economy in an election year.
On the contrary, certain headwinds remain for consumption to move higher from here on.
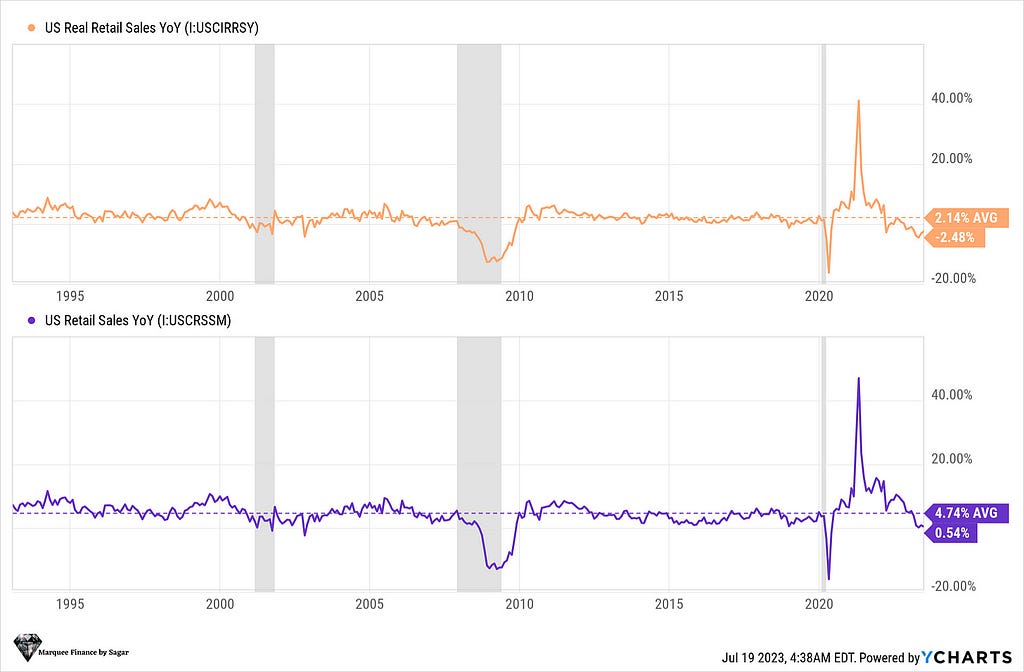
Real Retail sales (adjusted for inflation) have been soft for over seven consecutive months. As inflation cools off from the peak and the labour market is still resilient (especially for the bottom 90%), real retail sales seem to have bottomed out in May as we saw some upward revisions.
Nevertheless, the canary in the coal mine for the consumption part of the economy remains the student debt payments which will restart in October.
Notably, student debt remains the second largest source of HH debt in the US. (One can read this detailed article to understand student debt in detail)
Furthermore, as the excess savings completely dry up by the next quarter or so, we will see the most significant component of the GDP (65%: Consumption) take a significant hit.
PS: The Redbook retail sales have already plunged to a three-year low.
All in all, if the stock markets remain buoyant, we may see the positive wealth effect spilling over the economy even with student loan headwinds around the corner.
PS: Industrial Production data was also weak and contracted after a long time. However, we must see whether it’s an outlier on an ongoing trend.
The other part of the economy which many market participants consider integral for the business cycles due to its multiplier effect is the housing sector (remember the H.O.P.E model → Housing →Orders → Profits → Employment?). Lately, the encouraging data has confused many.
Let us decipher the housing data now.
One of the most significant factors that many people tend to ignore and have failed to understand this business cycle is the lag with which the housing cycle works.
On average, it takes eight months from the start to complete the single-family while 17 months for the multi-family development.
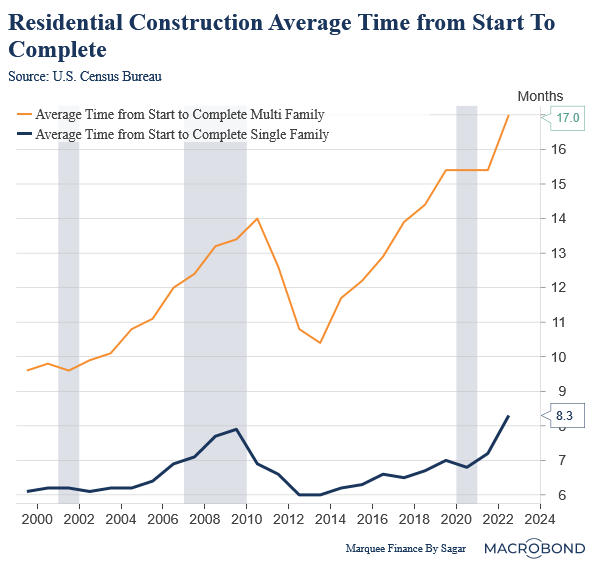
This becomes super important because we are very well aware of the fact that the housing boom post covid sawgargantuan activity in multi-family housing, and as a result, the backlog remains pretty high, thus supporting the economy (residential-fixed investment component of the GDP).

For single-family, the permits peaked in early 2022 when the Fed started to raise rates, but for multi-family permits peaked in Q3/Q4 of 2022.
Considering the 17 months and 8 months period as mentioned above, the weakness exhibited by the housing sector late last year was due to the single-family housing as starts fell drastically.
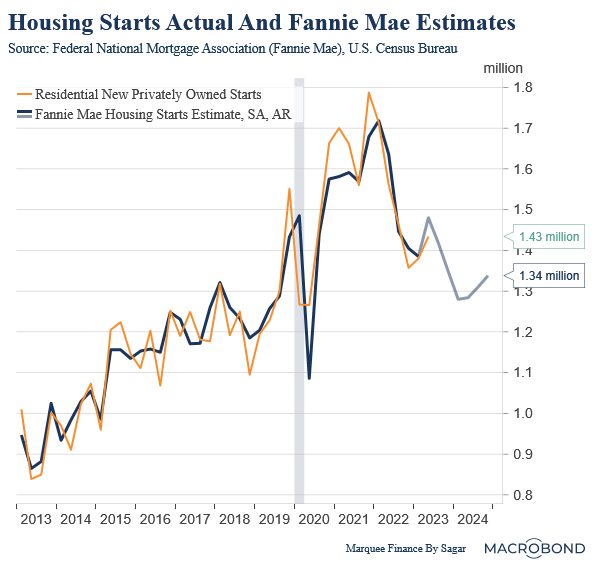
As per Fannie Mae’s highly reliable estimates, the starts will bottom out in late 2023, as starts lags permits. The current rise in housing activity thus is “transitory”.
This can also be cemented by the fact that while units under construction started to fall early this year for the single-family housing (remember 8 months lag?), the multi-family units continue to climb and are now at their highest level.

As the multi-family activity slows by the end of this year, we might see the second leg down for the housing activity.
Furthermore, the current strength can also be attributed to the low inventory of single-family housing and the strong labour market.
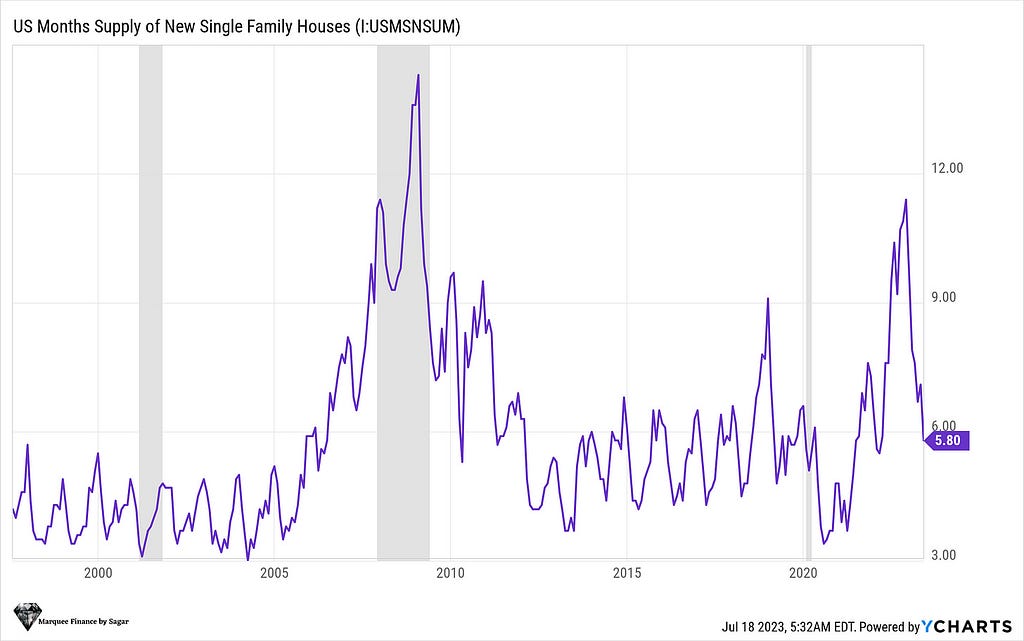
The low months of supply should limit the downside in the single-family unless the UR rises significantly to 6%+, and we absolutely get the demand crushed.
This is also one of the reasons that I have been in the “mild recession” camp and not in the hard landing camp.
Lastly, buoyant housing prices also lead to a positive wealth effect as home equity remains Americans’ biggest wealth source.
Existing Home Median Sales price recovering due to low inventory should boost the positive wealth effect.

On the contrary, one can easily conclude that it was the same in 2008 as the second leg of correction always ensues post the cracking of the most lagging indicator: “The Labour Market”.
Europe And China!
European data continues to deteriorate as core inflation remains higher, indicating no signs of weakness (though the headline is moderating thanks to the base effect).
As today’s focus remain on the housing sector, the German data is very intuitive as the permits lead the Existing Home prices by a few months.
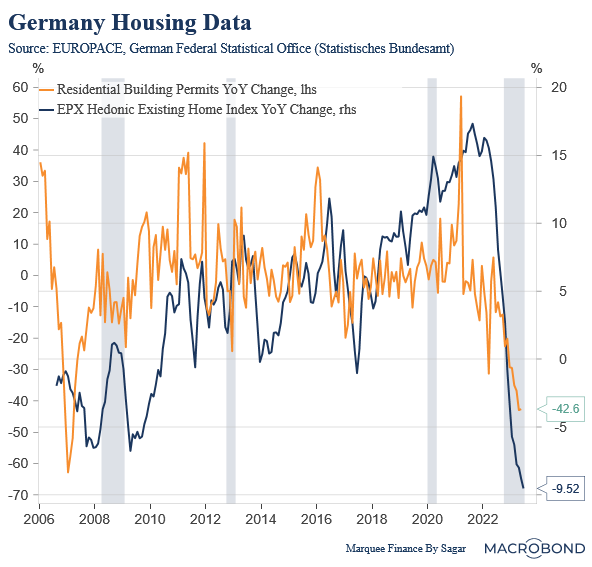
While the annual price decline is the worst ever, the fall in permits is the second largest since the GFC. However, it seems that the fall in permits has bottomed out.
Again, the German labour market remains relatively strong, and if we see a significant softening of the labour market in the coming quarters, the second leg down will transpire in the housing market.
Note that Germany is already in recession (2Qs of consecutive negative growth), and further rate hikes by ECB will lead to excruciating pain for the cyclical sectors of the economy.
China’s struggle to recover from the draconian covid lockdowns and the meltdown in the property sector is marred with challenges.

The youth unemployment rate touched all-time highs as millions of graduates entered the job market this year. While the CCP seems concerned about the high joblessness, the measures to prop up the labour markets have been muted so far.
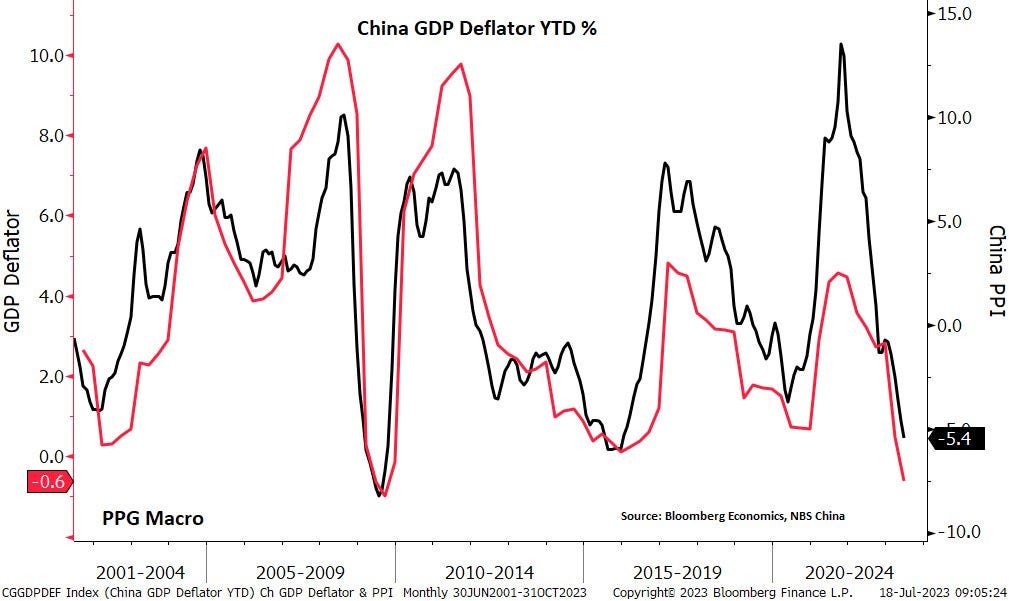
Furthermore, the Chinese GDP deflator turned negative for the first time since 2008 as it becomes more apparent that thedeflationary bust will take years to revive unless an enormous fiscal impetus is provided and the property market revival is assured.
The Households (HH) have used their excess savings from the pandemic to repay the mortgages (deleverage) instead of increasing consumption, thus dampening the prospects of higher growth.
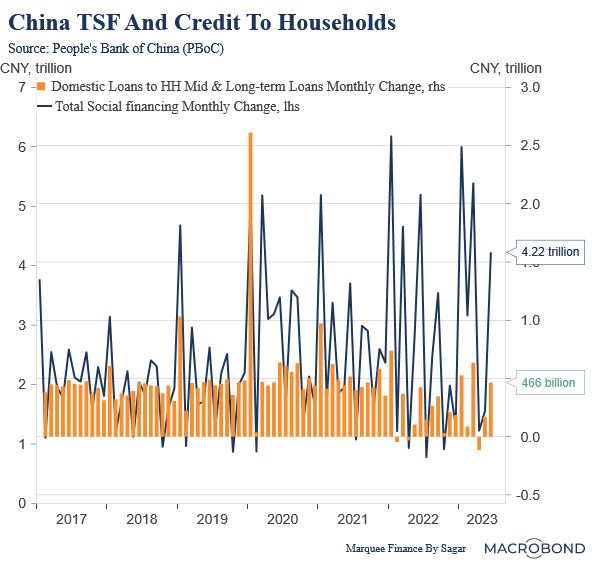
While the Total Social Financing (TSF) has moved higher in the last few months, the entire move is driven by the corporates or the local governments who need persistent debt injection to remain afloat (covered in detail here in case you missed it).
China remains the paramount concern for the global economy and hence the commodities.
Conclusion!
US:
- The headline inflation has bottomed out for 2023, and a 2% print is only possible if growth falters.
- The real retail sales are still in negative territory, and the upcoming student loan payments might lead to further weakness in consumption. However, one can’t ignore the positive wealth effect of the stock market rally.
- The long lag from start to completion gives an illusion of housing recovery. The next downturn will emerge in Q3/Q4 when multi-family falters, and the labour market weakens.
- Nevertheless, the downside in housing is limited as inventory remains tight. A hard landing might change that scenario.
Europe:
- Akin to the US, the headline inflation is cooling, but the core remains sticky as nominal wages are growing at 5–7%.
- The cyclical sectors of the economy, especially housing, are feeling the heat as the prices remain in a firm downtrend.
- The labour market remains the key, and if we witness any softening, the contraction will get exacerbated.
China:
- High youth unemployment, weak consumer sentiment and deflation remain the prime concern.
- The much-needed fiscal stimulus remains absent as baby steps fail to revive the animal spirits.
- LGFVs and regional banks are the canaries in the coal mine, and urgent measures are needed to rein their debt and non-performing loans, respectively.
Subscribe to DDIntel Here.
DDIntel captures the more notable pieces from our main site and our popular DDI Medium publication. Check us out for more insightful work from our community.
Register on AItoolverse (alpha) to get 50 DDINs
Join our network here: https://datadriveninvestor.com/collaborate
Follow us on LinkedIn, Twitter, YouTube, and Facebook.
The “Fairytale” Landing! was originally published in DataDrivenInvestor on Medium, where people are continuing the conversation by highlighting and responding to this story.
Disclaimer: Investing carries risk. This is not financial advice. The above content should not be regarded as an offer, recommendation, or solicitation on acquiring or disposing of any financial products, any associated discussions, comments, or posts by author or other users should not be considered as such either. It is solely for general information purpose only, which does not consider your own investment objectives, financial situations or needs. TTM assumes no responsibility or warranty for the accuracy and completeness of the information, investors should do their own research and may seek professional advice before investing.
