Indicators for Technical Trading
If a trader wants to make money trading options they need a way to determine if prices are doing up, down, or sideways. The strategies that you choose and the degree to which you hedge your risk in trading options will be based on what you think the market will do and how certain your are that it will do what you think. There are two basic ways to predict where the stock market will move next. Over the long term stocks go up and down based on how much money companies make. This is determined by fundamental factors like the company’s business plan, the economy, interest rates, and even events far from our shores like social unrest or even war.
Newsletter: Our Less-Than-10-Minute Video Overview of Today’s Market Activity
Over the shorter term a better way to predict market price movement is with technical analysis tools that help make sense of movements within the market itself. Learning the indicators for technical trading is a basic step on the way to becoming a successful options trader.
What is Technical Trading?
Traders of markets realized long ago that paying attention to price changes as the market progresses helps one predict where the market is going next. A simple example is when the market is steadily going up over time. Traders say that the trend is your friend. Very often one can just assume that the market has been going up so it will keep going up. This approach works for a time and then it doesn’t. Thus traders need to be able to understand when trends will continue and when they will reverse. More commonly a trader may find it difficult to see if there is any trend because prices jump up and down so much. A basic technical analysis tool that helps in this case is the moving average.
What Is a Moving Average?
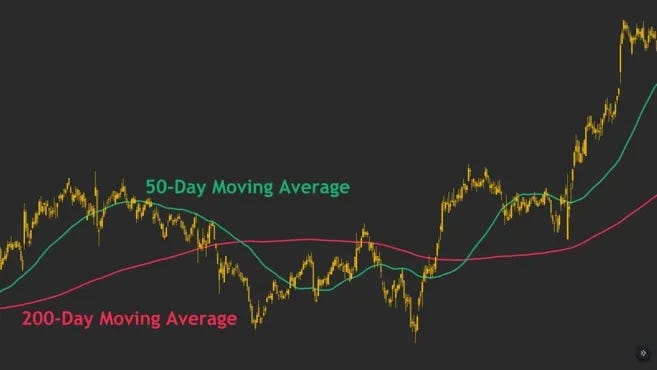
A simple moving average is the sum of prices over a period of time divided by the number of prices used to arrive at the sum. The point of using this tool is to remove random and short-term fluctuations that generally cancel each other out over time. A simple moving average will often show a trend that is otherwise hidden in the “static” of daily and weekly market ups and downs. Traders commonly use two moving averages on the same chart in order to help identify support and resistance levels. Something that we commonly mention at Top Gun Options is that the market does not like to stay between moving averages. Thus, it will typically break out to the upside or downside. Learning to use a tool like the moving average by working with a dedicated trading squadron like at Top Gun Options gives a trader a valuable skill for successful options trading.
Useful Technical Indicators for Options Trading
There are several indicators that a technical trader will commonly want to know how to use. These include the relative strength index, Bollinger Bands, the intraday momentum index, the money flow index, the put to call ratio indicator, and the current level of open interest. And, no, a new options trader does not need to use all of these or immediately learn how to use them to begin trading. Successful traders commonly use one or two indicators.
What Does a Technical Indicator Tell You?
What traders learn from technical indicators are things like how much trading volume there is, if options market sentiment is trending toward puts or calls, and if specific price patterns arise that have specific predictive value. We mentioned that traders commonly use two moving average indicators set for different timeframes. When a short term moving average moves above a long term moving average it is called a golden cross and commonly indicates that the stock price will continue to rise. When a short term moving average moves below a long term moving average it is called a death cross and typically means the stock is going to keep heading down.
Common Sense and Technical Indicators
Technical indicators are not truth itself. They are best used as tools to confirm what you are seeing as you trade the market. At Top Gun Options we routinely pay attention to what is going on domestically and across the world. Things happening far from our shores eventually affect stock and options trading here at home. We always say that the market only cares when it cares. Thus, the market may ignore potentially important information at first and then react later. Paying attention to technical indicators helps a trader see when the market starts to pay attention and gives them a heads up as to how prices will react. Despite all of this, markets can be confusing. That is why the best course of action is commonly to trade with a dedicated squadron like at Top Gun Options where we potentially print money in up, down, and sideways trading markets.
Special Video Shows Why You Only Need to Own One Stock!
Originally published at https://topgunoptions.com on September 1, 2023.
Disclaimer: Investing carries risk. This is not financial advice. The above content should not be regarded as an offer, recommendation, or solicitation on acquiring or disposing of any financial products, any associated discussions, comments, or posts by author or other users should not be considered as such either. It is solely for general information purpose only, which does not consider your own investment objectives, financial situations or needs. TTM assumes no responsibility or warranty for the accuracy and completeness of the information, investors should do their own research and may seek professional advice before investing.
