TLT: Deflation Is Still Risk And Bonds Are Cheap
m63085
I last wrote on the iShares 20+ Year Treasury Bond ETF (NASDAQ:TLT) in March following the collapse of SVB bank when the macroeconomic outlook appeared highly deflationary following the surge in interest rates and collapse in money supply and commodity prices. Six months on, while CPI has fallen, inflation expectations have drifted higher in line with the recovery in risk appetite. However, with bond yields rising, equity valuations at extremes, the money supply in deep contraction, and the real economy weakening, a deflationary episode remains a major risk. I remain long the TLT, which yields 4.5% on a yield to maturity basis, which is significantly higher than long-term inflation expectations and is back above the economic growth rate.
The TLT holds US Treasuries of maturities of 20 years or more, with a weighted average maturity of around 26 years, and an effective duration of 17 years. The TLT is the largest Treasury ETF by assets under management, with shares outstanding actually accelerating over the past few years despite the fall in prices. The high duration means that the ETF tends to post strong capital gains during times of economic weakness and/or disinflation as interest rates expectations decline.
Breakeven Inflation Expectations Are A Key Driver Of Bond Yields
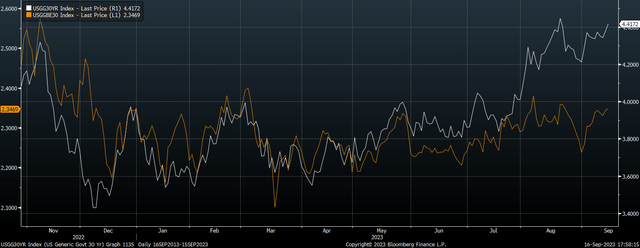
When it comes to bond investing, inflation expectations are much more important than headline CPI. For a bond fund such as the TLT which has an average maturity of 26 years, current CPI figures are of much less importance than investor expectations of inflation over long term years. The chart below shows 30-year breakeven inflation expectations as measured by the yield spread between 30-year US Treasuries and Treasury Inflation Protected Securities. 30-year bond yields have risen alongside rising inflation expectations as investors require higher compensation for this inflation.

30-Year UST Yield Vs 30-Year Breakeven Inflation Expectations (Bloomberg)
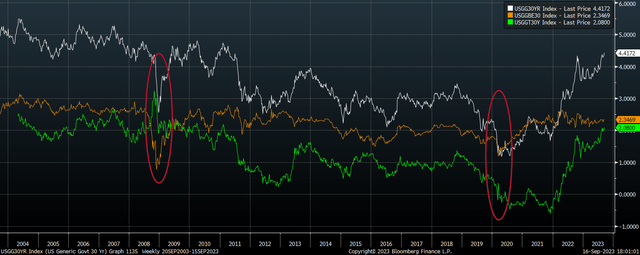
We can break down long-term bond yields into inflation expectations and the real yield above expected inflation that investors require. As the chart below shows, the most important driver tends to be the real yield, which most of the time exhibits larger moves relative to inflation expectations. However, during market panics, collapsing inflation can cause bond yields to fall sharply as we saw in 2008 and 2020.

US 30- Year UST Yield, 30-Year Breakevens, and 30-Year TIPS Yield (Bloomberg)
Short-Term And Long-Term Inflation Drivers Differ Greatly
I am confident that the average inflation rate over the next 20 years will be higher than the 2.3% implied by 30-year breakevens. As I argued in 'The U.S. Dollar Privilege Likely Ending - Diversify Now', the widening fiscal deficit and inevitable rise in money supply relative to productive capacity suggest inflation may average significantly higher than this. However, there is a growing risk that inflation expectations and headline inflation itself fall sharply over the coming quarters as demand for cash rises amid falling equity and real estate prices.
While over the long term inflation is driven predominantly by the supply of money and government bonds relative to real output, in the short term it is driven largely by psychological factors that determine consumer and investor demand for cash relative to goods and services. While recessions themselves are inflationary as more money chases fewer goods and services, market panics are highly deflationary. During periods of falling assets consumers and investors seek liquidity regardless of its supply outlook. This demand for liquidity takes the form of US dollar cash and bonds, which has the potential to become self-reinforcing as falling assets cause increased demand for cash which causes further declines in assets, etc.
Deflation Risk And High Real Yields Suggest TLT Should Perform Well
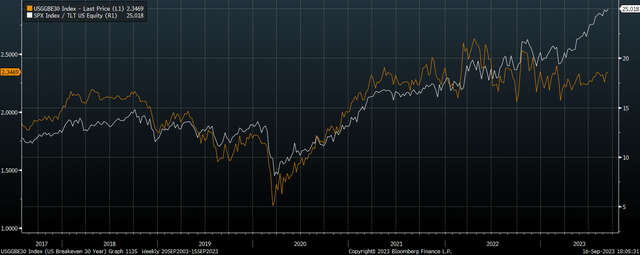
While such panics are rare, they have previously tended to occur under similar circumstances as we see today. Specifically, with bond yields rising, equity valuations at extremes, money supply in contraction, and the real economy weakening. These are the conditions under which investors have typically sought the safety of Treasuries and shunned equities and other risk assets. The chart below shows the ratio of the S&P 500 over the TLT alongside long-term inflation expectations.

Ratio of SPX over TLT Vs 30-Year Breakevens (Bloomberg)
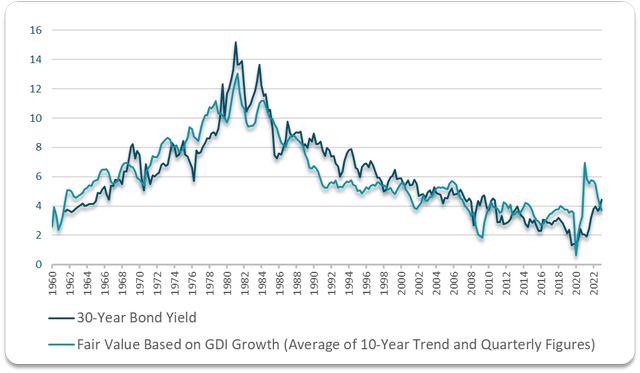
Even if we do not see a deflationary episode and inflation expectations continue to rise, the TLT's yield of 4.5% offers a high margin for any such increase while still allowing investors to generate positive real returns. The 2.1% real yield is the highest since 2011, which is significantly higher than the real GDP growth outlook. Even with headline CPI widely expected to fall, long-term bond yields are back above their fair value implied by nominal gross domestic income. The chart below shows the fair value 10-year yield based on its historical correlation with GDI. 10-year yields are current 70bps above fair value on this basis, which is the largest spread since 2011.

Bloomberg, Author's calculations
The Main Risk Comes From Long-Term Fiscal Deficits
In the short term, the main risk to the TLT comes from continued high interest rates as interest rate futures are already pricing in quite aggressive cuts over the coming years and a long pause would likely send yields higher across the board. However, the longer rates remain elevated, the greater the likelihood that a deflationary episode occurs in 2024, sending yields much lower. Further out, the main risk is that widening fiscal deficits drive up inflation, undermining real returns.
Disclaimer: Investing carries risk. This is not financial advice. The above content should not be regarded as an offer, recommendation, or solicitation on acquiring or disposing of any financial products, any associated discussions, comments, or posts by author or other users should not be considered as such either. It is solely for general information purpose only, which does not consider your own investment objectives, financial situations or needs. TTM assumes no responsibility or warranty for the accuracy and completeness of the information, investors should do their own research and may seek professional advice before investing.

