Major Equity-Bond Reversal Expected As Recession Approaches
DNY59
US large cap stocks have outperformed US Treasuries by near record amounts over the past decade, and this has provided a great opportunity for investors to shift into bonds and away from stocks. I last made the case for US bonds relative to stocks last year on the basis of relative valuations and the weak nominal growth outlook. Remarkably, equity outperformance has actually accelerated since then even as inflation expectations and consumer confidence has fallen, marking a major departure from the past 5 years. We are now in extremely dangerous territory for equity investors and I fully expect the S&P500 to lose at least 50% relative to long term bonds such as those comprising the iShares 20 Plus Year Treasury Bond ETF (TLT) over the course of the next down cycle.
Stocks Have Outperformed Even As Inflation Expectations And Consumer Confidence Have Fallen
The performance of the S&P500 relative to long-term US bonds has typically moved in line with inflation expectations, as measured by the difference in yield between Treasuries and inflation-protected Treasuries. This makes sense as stocks are real assets whose earnings rise in line with inflation, while bonds suffer as yields tend to move up. From 2018 to 2022 the two variables showed an R-squared of 0.93, but over the past year this relationship has completely broken down, with stocks rising and bond prices falling even as inflation expectations have fallen. Based on this correlation over the past decade, the ratio of the S&P500 over the TLT should be at least 30% below current levels.
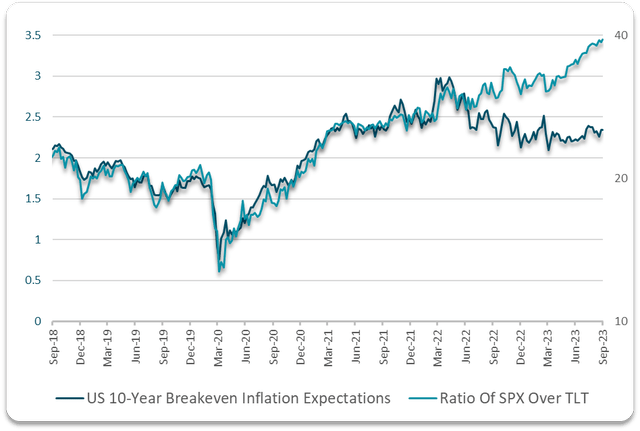
Bloomberg, Author's calculations
From a longer-term perspective, the performance of stocks over bonds have been closely linked with consumer confidence. Improving levels of confidence in the economic outlook tends to mean investors are willing to pay more for stocks relative to bonds. However, over the past few years, the SPX/UST ratio has risen even as consumer confidence has fallen. As seen below, the ratio is extremely high relative to the Conference Board's Consumer Confidence Index, which is consistent with a SPX/UST ratio 50% below current levels.
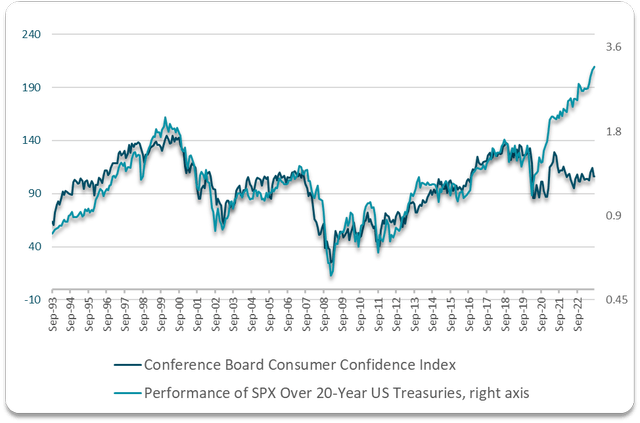
Bloomberg, Author's calculations
The equity-bond ratio has also diverged from nominal GDP growth, which it has tracked quite closely over the past 30 years. Nominal GDP growth looks set to slow further as gross domestic income growth is now at just 3.1% in nominal terms and -0.5% in real terms. Since the 1940s there has never been a negative real GDI print outside of an official recession, and the average print at the start of these recessions has been 2.1%. The same is true of the Conference Board's Leading Economic Indicator index, which at -7.5% is consistent with a recession.
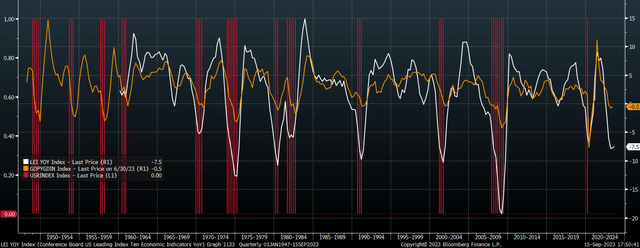
Real GDP Growth, LEI Growth, and NBER Defined Recessions (Bloomberg, Conference Board)
Valuations Suggest Stocks May Underperform Bonds By Double-Digits Annually For A Decade
The phenomenal rise in stocks relative to bonds has left the long-term outlook the most negative it has been outside the peak of the 2000 bubble, following which the S&P500 underperformed long-term Treasuries by 8% annually over the next 10 years. Regardless of the valuation metric used, the S&P500 is priced to perform poorly over the long term unless earnings growth is multiple times higher than it has been historically. The next chart shows the implied annual 10-year returns for the S&P500 based on various valuation metrics and their correlation with subsequent returns in the past. These range from 5.4% annual nominal returns based on the trailing PE ratio and -1.8% based on the price/EBITDA ratio.
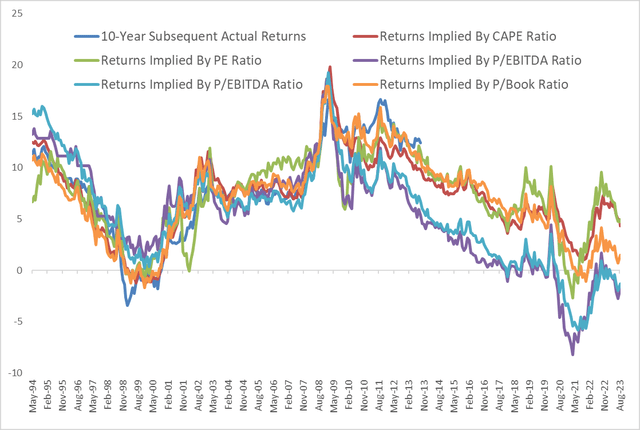
Bloomberg, Author's calculations
If we take an average of all these valuation metrics, current valuations imply 10-year total returns of around 1.5% annually. Comparing this to the yield to maturity on 10-year USTs of 4.3%, this is the largest spread in favor of bonds since the 2000 peak. The chart below shows projected S&P500 10-year annual excess returns over 10-year USTs and historical realized 10-year annual excess returns. The two variables have an R-squared of 0.92 going back 30 years and suggest the S&P500 should lose almost 3% annually over the next decade.
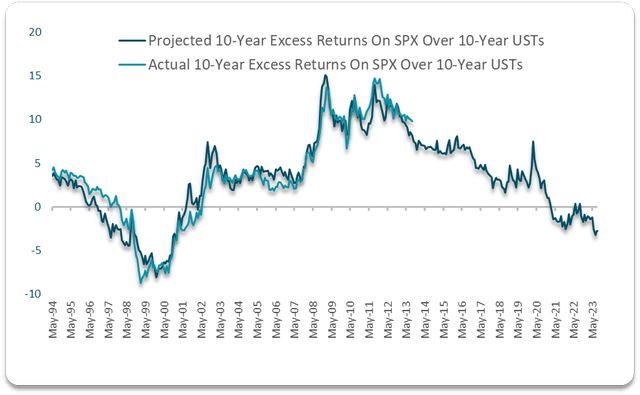
Bloomberg, Author's calculations
This correlation between valuations and subsequent long-term returns also holds up if we look further back in time. The following chart shows the correlation between valuations and 10-year subsequent annual total returns going back to 1947, using the CAPE ratio and the ratio of market capitalization to GDP. The current CAPE ratio is consistent with 4% annual returns while the so-called Buffet ratio is consistent with 0% annual returns. Taking an average of the two, the S&P500 is priced to underperform 10-year USTs by at least 2% annually, which compares to a post-WW2 average of over 5% outperformance.
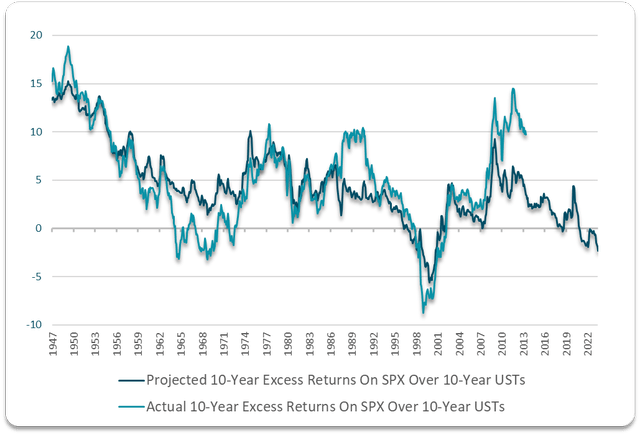
Bloomberg, Rober Shiller, Author's calculations
Continued Equity Outperformance Would Require A Currency Collapse
The return projections based on the charts above implicitly assume that the growth in S&P500 fundamentals in the future will broadly match the pace of growth they have seen in the past. However, there are many reasons to believe that future nominal GDP and cyclically adjusted earnings growth will be significantly lower as a result of slower real GDP growth. Since 1947 US real GDP growth has averaged 3.1% annually, and this has slowed to 1.7% since the pre-Global Financial Crisis peak. This is likely to slow to around 1% over the next decade in line with the long-term declining trend of productivity growth as I argued in '1% U.S. Long-Term Real GDP Growth A Best-Case Scenario'.
If fundamentals grow at 1% in real terms over the next decade and inflation averages 2.3% as 10-year breakeven inflation expectations suggest, the S&P500 should rise by 3.3% annually. When adding the 1.5% dividend yield, stocks should return 4.8% annually assuming that valuations remain at current extremes. This may seem reasonable as it would be 0.5% above the return on 10-year USTs.
However, if investors were to require an equity risk premium of 5% in line with the post-War average we would likely have to see the dividend yield rise by 4.5% to 6% so that the total return outlook rises to the 9.3%, reflecting the sum of the 10-year UST yield and this 5% equity risk premium. This would require a 75% decline in valuations, and if this were to take place gradually over the case of the next decade, it would result in negative annual returns of around -9%, resulting in over 13% underperformance relative to US Treasuries.
Surging Inflation The Main Risk, Which Is Why I Prefer TIPS
An alternative possibility is that fundamentals would have to grow at an average annual pace of almost 7% in order for sales, earnings, and dividends to grow sufficiently to maintain current valuations and allow stocks to outperform bonds. The most likely way for this to occur is through a sustained rise in inflation. However, the problem here as I explained in 'Inflation And Stocks: The Good, The Bad, And The Ugly' is that high rates of inflation have a tendency to drive down equity valuations. We would therefore likely need to see a collapse in the currency sufficiently for nominal earnings and dividends to rise and offer any declines in equity valuations. It is for this reason that I prefer to own Treasury Inflation-Protected Securities which offer protection for such an inflation surge.
Disclaimer: Investing carries risk. This is not financial advice. The above content should not be regarded as an offer, recommendation, or solicitation on acquiring or disposing of any financial products, any associated discussions, comments, or posts by author or other users should not be considered as such either. It is solely for general information purpose only, which does not consider your own investment objectives, financial situations or needs. TTM assumes no responsibility or warranty for the accuracy and completeness of the information, investors should do their own research and may seek professional advice before investing.

