USHY: A Competitor To The S&P 500's Low Earnings Yield
tumsasedgars
I read a research note from Goldman Sachs earlier this week. Their team sees domestic high-yield defaults ticking higher over the coming months, but then retreating in the back half of next year. Then just this morning, S&P Global reported that corporate defaults jumped last month, marking the highest tally since 2009 all while corporate buybacks were down 20.4% from year-ago levels in Q2. Higher interest rates are clearly taking their toll on corporate decision-making and price action in the junk bond space.
I am reiterating my hold rating on the iShares Broad USD High Yield Corporate Bond ETF (BATS:USHY). I continue to like its high yield-to-maturity compared to the real earnings yield on the S&P 500, but that is offset by credit spreads that remain modest.
Corporate Defaults Set to Tick Higher - Goldman
Goldman Sachs
According to the issuer, USHY aims to replicate the performance of an index consisting of U.S. dollar-denominated, high-yield corporate bonds. The ETF provides exposure to the junk bond market on a broader scale than most other ETFs currently available. Additionally, USHY has cost efficiency, offering investors a low-cost option for accessing low-grade bonds. It can be strategically used in portfolios to complement core fixed-income holdings. The fund seeks to track the performance of the ICE BofA US High Yield Constrained Index, by using a representative sampling technique.
USHY is a large fund with total assets under management of $9.1 billion as of September 13, 2023. Most important, in my view, for investors to know is that USHY has a current yield to maturity of 8.6%. Now, if some first prepay their debt, then the yield at worst could be slightly under that rate. Still, 8.6% could be compared to the S&P 500 earnings yield near 5.5%. On a real basis, USHY’s YTM is about 6.3%, making it somewhat attractive compared to owning domestic stocks. At the very least, it can diversify an equity allocation while not sacrificing much return potential.
USHY features an annual expense ratio of just 0.15%, earning it a strong A- ETF grade, while its liquidity is very strong (an A+ rating) given 90-day average volume of nearly 5 million shares and a median 30-day bid/ask spread of just three basis points. The fund is also highly diversified with more than 1,800 individual holdings and the duration is much less than that of the investment grade index at just 3.7 years, per iShares.
USHY Portfolio Breakdown
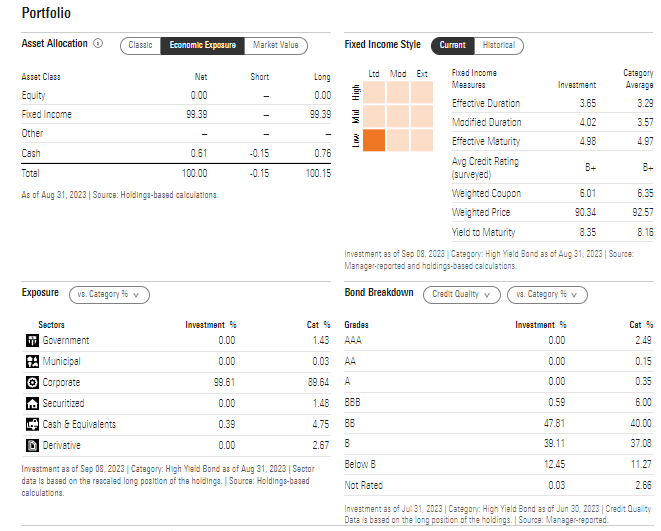
Morningstar
USHY Sector Diversification
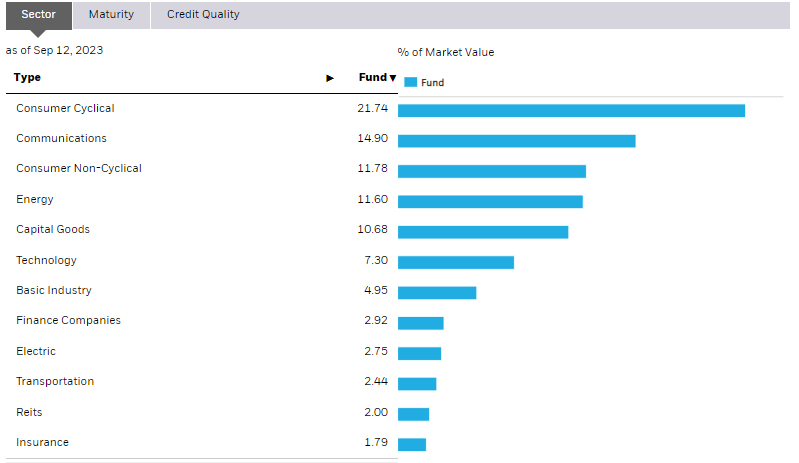
iShares
Low-Quality Corporates Yield 2x That of 2021 Levels
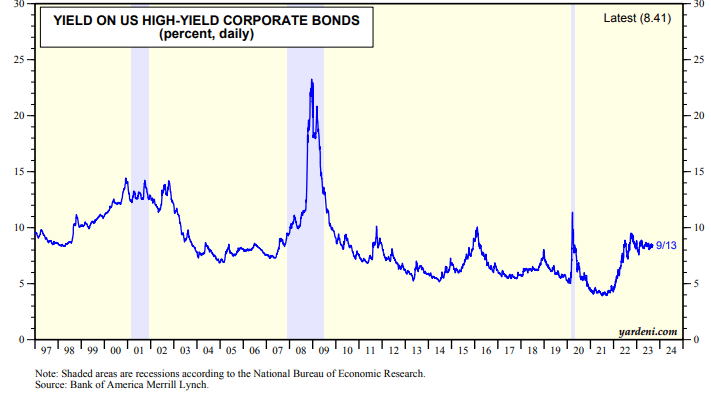
Yardeni
Say What? Junk Bond Yield Nearly The Same As Mortgage Rate Levels
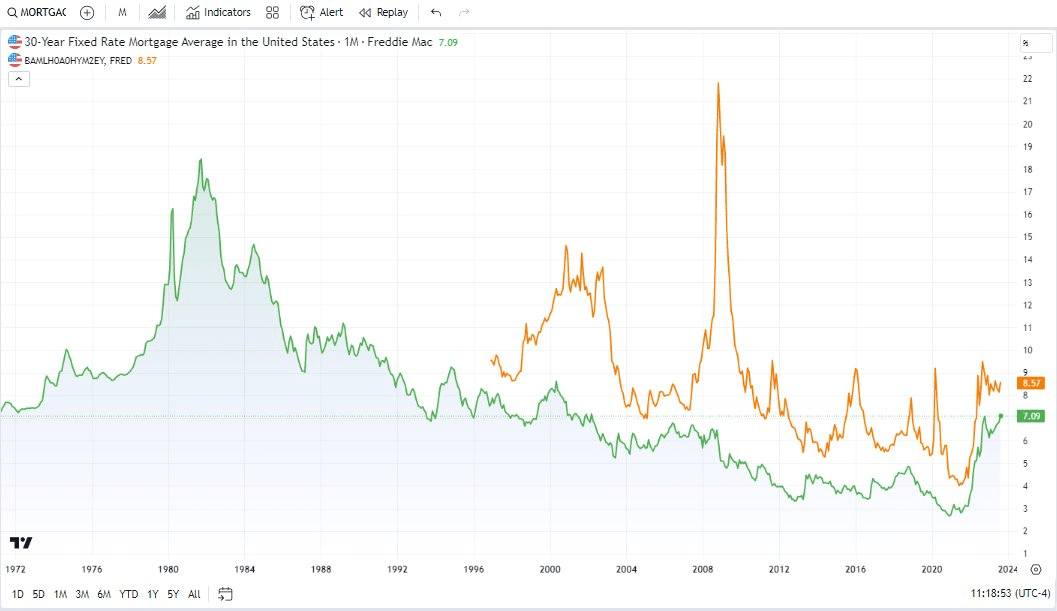
TradingView
US HY OAS Near Multi-Year Lows, A Bullish Macro Indicator
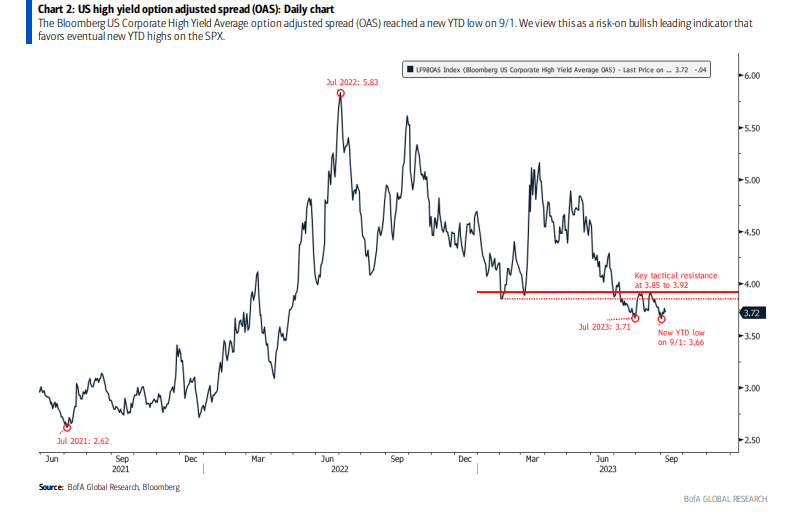
BofA Global Research
USHY Seasonality: Bearish Near-Term Seasonal Trends
Equity Clock
The Technical Take
USHY has risen from near $31 a year ago to above $35 on a total return basis. Since I last reviewed the fund, it is up slightly better than 3%. So, it’s steady as she goes in the junk bond space. Could that be about to change? Notice in the chart below that the fund is now in a symmetrical triangle consolidation pattern, and USHY is nearing the apex of the coil formation.
The implication is that the trend of larger degree prevails, and the magnitude of the move would equate to the height of the triangle. In this case, the broader trend appears lower given that lower highs have been made since August last year, though the October 2022 lows have held. What’s key to watch is if we get a bullish breakout above $36 or a bearish breakdown below $34, the $3 triangle height would then portend an upside target to $39 or measured move downside price objective of $33.
With bearish seasonals in play and soft momentum, we must be mindful of a breakdown over the next few weeks. If we get past mid-October, then it could be smoother sailing to year-end.
USHY: ETF Coils, Eyeing $36 and $34 For the Next Move
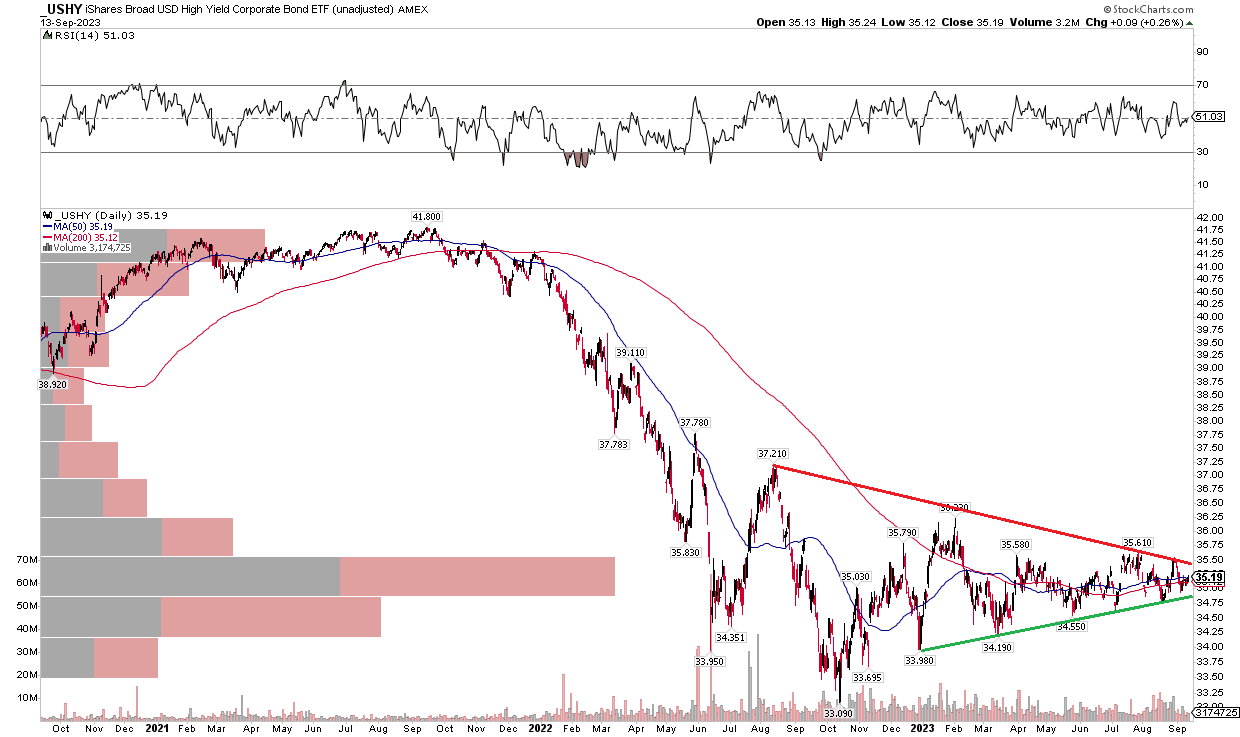
Stockcharts.com
The Bottom Line
I reiterate my hold rating on USHY. Its yield remains compelling relative to the real earnings yield on the S&P 500 while bearish seasonality and a consolidating chart pattern create added risk in the very short run.
Disclaimer: Investing carries risk. This is not financial advice. The above content should not be regarded as an offer, recommendation, or solicitation on acquiring or disposing of any financial products, any associated discussions, comments, or posts by author or other users should not be considered as such either. It is solely for general information purpose only, which does not consider your own investment objectives, financial situations or needs. TTM assumes no responsibility or warranty for the accuracy and completeness of the information, investors should do their own research and may seek professional advice before investing.
